
Research Article | DOI: https://doi.org/10.58489/2836-3590/013
1 Department of Geology, University of Benin, Benin City.
*Corresponding Author: Andre-Obayanju, O
Citation: Andre-Obayanju O (2023), Thrombotic Thrombocytopenic Purpura as The Debut of Systemic Lupus Erythematosus. Pollution and Effects on Community Health 2(2). DOI: 10.58489/2836-3590/013
Copyright: © Andre-Obayanju O, (2023). this is an open access article distributed under the Creative Commons attribution License, which permits unrestricted use, distribution, and reproduction in any medium, provided the original work is properly cited.
Received: 25 March 2023 | Accepted: 15 April 2023 | Published: 17 April 2023
Keywords: Water quality, Flood, Dumpsite,
The study was carried out in Egor local government area, Dumpsite in Ovia North-East local government area of Edo state. The study areas are located between latitudes of 6°27'27.8''N to 6°27'44.6''N and longitudes of 5°35'58.7″E to 5°36'16.8''E in Egor local government area and the dumpsite is located with a latitude of 6°22´1.2''N to 6°27´51.3″N and longitudes of 5°36'42.3''E to 5°36´2.1″E in Ovia North-East local government area. A total of five (5) water samples were collected from an existing borehole at different locations within the study area. Physiochemical test, Major anion and cation concentration was determined using Atomic Absorption Spectrophotometer (AAS). Microbiological Parameters for all the water samples was also determined. The following are the physiochemical parameters, major cations and anions that was analysed from all the water samples collected: pH, EC, TDS, Na+, Ca+, Mg2+, Cl-, NO3- , HNO3- , HNO3- , SO42- , Cr2-, Cd-, Ni-, and Pb2+ and the Microbiological parameter analysed for all the water samples are Coliform and E. Coli. The Microbiological parameter analysed for are Coliform and E. Coli as shown in Table 1. The results reveals that the study areas have average value of pH (4.89) which is below the WHO (2011) and NSQW (2007) standard permissible limit of 6.5-8.5 and this indicates that the water is slightly acidic probably due to the presence of decayed organic matter in high amounts and mineral acids produced during hydrolysis. The average values of E.C (121.86μS/cm), TDS (46.52mg/l), Na+ (1.48mg/l), Cl- (53.85mg/l), NO3- (1.17mg/l), HNO3- (0.39mg/l), SO42- (0.12mg/l), Cr2- (0.031), and Ni- (0.0074) conforms with the WHO (2011) and NSQW (2007) standard for drinking water expect some physiochemical parameters : Ca2+, Mg2+ Cd-, Pb2+, E.Coli and Coliform which has average values (4.49mg/l, 3.10mg/l, 0.027mg/l, 0.016mg/l, 1.36 X 10³ (cfu/100mL)and 1.06 X 10³ (cfu/mL) which do not conform with the WHO (2011) and NSQW (2007) for drinking water because of many factors and anthropogenic activities on the environment which contaminated the groundwater of the study areas. The results analysed from the three-study area reveals that the physiochemical parameters and microbiological parameters show similar trend. The water sample collected in the premises of University of Benin is more acidic compare to other water samples from the other locations. This probably due to the presence of decayed organic matter in high amounts and mineral acids produced during hydrolysis.
Heavy rainfall drainage system blockage, building on flood plains and poor planning/land use are leading causes of flooding which have destroyed property and houses. (Giuseppe et al, 2019). The adverse effects of flooding include: Loss of human life. Property and Infrastructure damage. Road closures, Erosion, and Landslide risks. Flooding is defined as the submerging of land under water, especially due to heavy rain, a lake or river overflowing. In Benin city, flooding is a recurring event because of poor drainage system.
Urban flooding is a main impact of meteorological and climatic change. Water is an essential part of life and that is why we need to protect its quality as much as we can. Despite the fact that clean water is essential for humans and in general, growth of life, some areas and societies do not have access to it due to contamination of their water sources. Groundwater is water present beneath Earth's surface in rock, soil pore spaces and in the fractures of rock formation. A rock unit that can yield a usable amount of water is called an aquifer. The quality of groundwater can be preserved when boreholes are planted at areas far from sources of pollution. Groundwater is said to be contaminated when pollutant rare released to the ground and make their way into groundwater.
Pollutants that canal tether quality of groundwater when exposed to it include bacteria, heavy metals, nitrates, viruses etc. When these pollutants come in contact with the water, they can lead to spread of diseases in the neighboring communities. These contaminants pollute water supplies as a result of in adequate treatment and disposal of waste from humans and livestock, industrial discharges and over-use of limited water resources (Singhand Mosley, 2003.).
Groundwater is a major source of drinking water in Nigeria extending even to a semi-urbanicity like Benin City as there are a good number of houses with boreholes erected in them. This study therefore is to examine and compare the quality of water in Benin City with reference to dumpsite environments and flood prone areas. Parameters including; heavy metals concentration, pH, conductivity serves a as a guide to drawing useful conclusions as to the quality of water in these environments.
The study area is located between latitudes of 6°27'27.8''N to 6°27'44.6''N and longitudes of 5°35'58.7″E to 5°36'16.8''E in Egor local government area and the dumpsite is located with a latitude of 6°22´1.2''N to 6°27´51.3″N and longitudes of 5°36'42.3''E to 5°36´2.1″E in Ovia North-East local government area. The areas of the study affected by flood episodes especially in the rainy season are located in Egor local government area. Egor and Ovia North-East local government area falls under the Tropical Savannah Climate while the LGA covers a total area of 93 Km2 and 2,301 km2 respectively (Giuseppe et al, 2019) and a population of 3,40,287 and 1,53,849 (National Population Commission, 2016). There are different tribal groups that made up of Egor local government namely: the Esan, Bini, Owan and of Ovia North-East local government namely: Okada, Uhen, Utese, Okokhuo, Uhiere, Isiuwa, Ekiadolor, Oluku e.t.c. The aim of the study is to evaluate the quality of water within and around flood prone area and dumpsite environment in part of Benin metropolitan city. The study area experiences two major seasons
which are the rainy and the dry seasons while the average temperature of the area is at 28 °C. The estimated humidity level of the Egor and Ovia North East local government area is estimated at 68 percent. The people are predominantly farmers. Benin City’s climate is hot and humid. The rainy season is from April to November while the dry season is from December to March. Temperature in Benin City is very high with an average daily temperature of about 28 °C in the dry season and about 24 °C in the wet season. The study area has a low temperature range. Benin City and its environs experience intense rainfall especially in the rainy or wet season. Rainfall is present all year, with an annual total of 2000–2300 mm, and monthly average of about 180 mm (Ministry of Environment, Benin Report 2009). This intense rainfall is induced by excessive evapotranspiration in the urban area due to prevalent high temperature. Relative humidity in the study area is also high, reaching about 80% in the wet season and 70% in the dry season (Manpower Nigeria 2020).
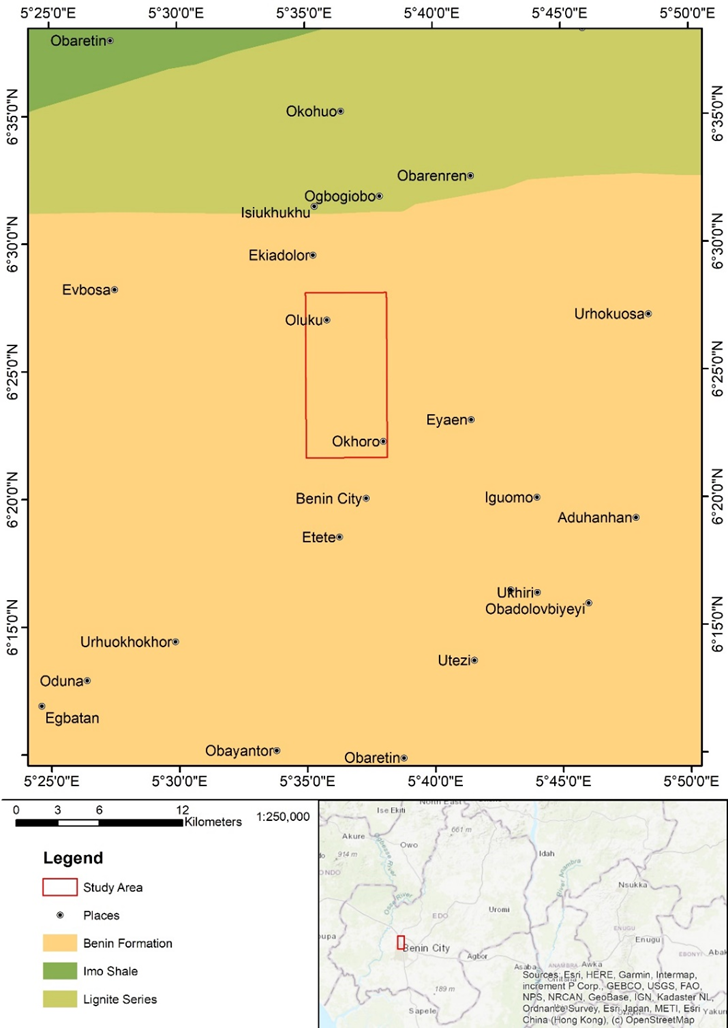
The Delta Region is underlain by Sedimentary Formation of the South Sedimentary Basin (Short and Stauble, 1967). The South Sedimentary Basin is made up of Sedimentary Formation which the Benin Region is lying on. The geology is marked by top reddish earth, composed of ferruginous or lateralized clay sand. The term Benin sand was first used to describe the reddish earth underlain by sands, sandy clays and ferruginous sandstone that marked the Paleo-coastal Environment of Paleocene-Pleistocene Age. Delta Region comprises of Benin Formation, alluvium, drift/top soil and Azagba-Ogwashi (Asaba-Ogwashi) Formation (Short and Stauble, 1967). The geology of the study area is marked by lateralized Clay, Sand and Sandstone. The Sandstone marks the Paleo-Coastal Environment of Palaeocene-Pleistocene Age (Reyment R.A 1965.) These sediments spread across the southern fringes of the Anambra Basin and marking the upper facies off-flaps of the Niger Delta Basin (Catherine, 2016). The name Coastal Plain Sands is use to describe the Formation of red earth underlain by Sands and Clays that mark an ancient Coastal Plain Environment now exposed in Calabar, Owerri, Onitsha (Catherine, 2016). The Delta Region is Oligocene-Pleistocene in age. The dip direction of the Benin Formation southward. The study area is underlain by the Benin Formation which is an important groundwater reservoir. The Benin Formation is characterized by top reddish to reddish brown lateritic massive fairly indurated Clay and Sand, capping thick sequences of poorly bedded friable – loose sand gravelly- pebbly sand and pinkish – white clay stringers (Oomkens, E., 1974). The sedimentary sequence is poorly bedded with discontinuous clay horizons at different depths. They are exposed at various erosion sites, sand quarry sites, and road cuttings. The Benin Formation covers 95% of the region.
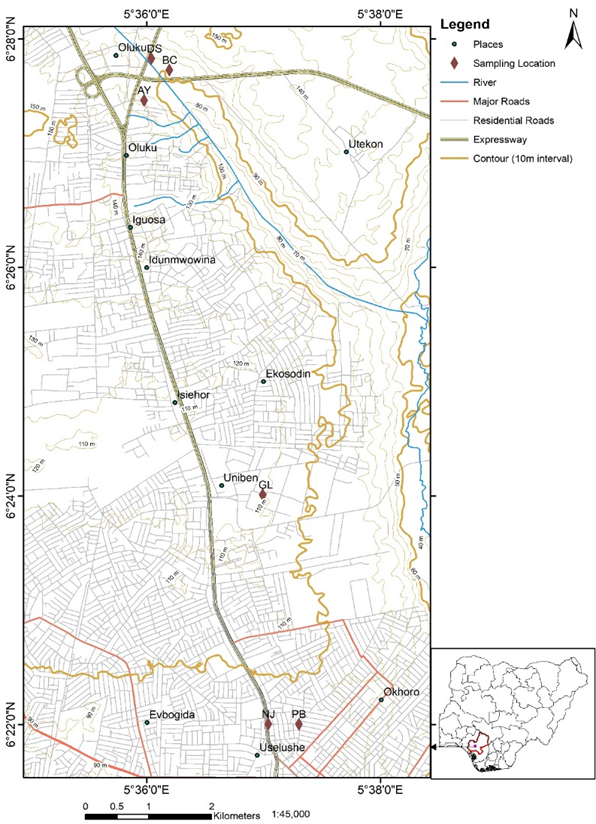
A total of five (5) water samples were collected from an existing borehole at different locations within the study area. Sample 1 and 2 (AH and BCH) were collected around Otofure area (around the Oluku dumpsite) and the samples were taken 50 meters and 100 meters away adjacent to the dump site respectively. Sample 3 and 4 were collected around Tomlin area and this study area is between the flood prone area and the road is usually flooded when rain falls, the road flooded because of poor drainage system in the environment. Samples are taken adjacent to the flooding site 50-meter sand 100meters away respectively. Sample 5 was collected in the premise of University of Benin (around geology department). The plastic bottles were first washed thoroughly using distilled water and dried. Before taking the water samples, the bottles were rinsed with the water to be taken as sample. The bottles were labeled accurately and kept in ice-box container and transported immediately to the laboratory for analysis. The following are the materials used for the study include: Sample bottles (0.75Lplasticbottles); Field notes book and pen; Measuring Tape; Masking Tape; GPS (Global Positioning System) and Compass.
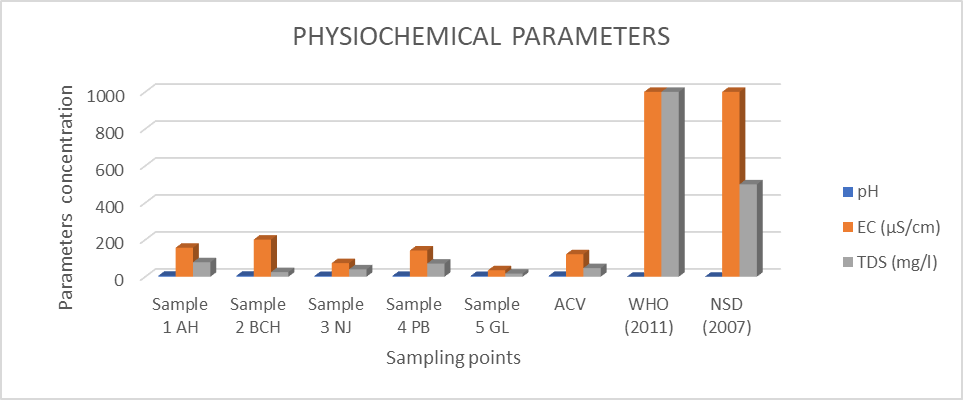
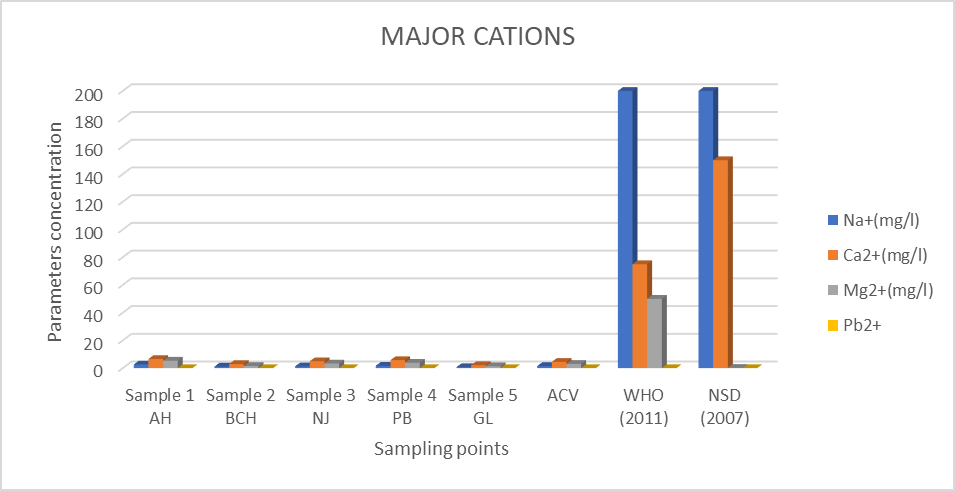
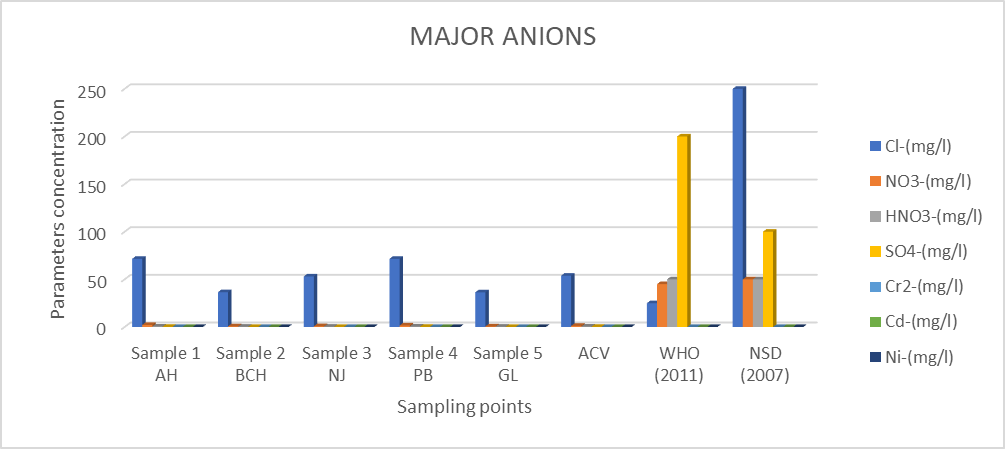
From (Table 1 and 2), the following are the physiochemical parameters, major cations and anions that was analysed from the water samples collected: pH, EC, TDS, Na+, Ca+, Mg2+, Cl-, NO3- , HNO3- , HNO3- , SO4- , Cr-, Cd-, Ni-, and Pb2+ as shown in Figure 1,2 and 3. The Microbiological parameter analysed for are Coliform and E. Coli as shown in Table 1.
The pH values range from 4.43 to 5.37 with average value of 4.89 with mean and standard deviation values of 4.89±0.49, EC values range from 35.01 to 201.18(μS/cm) with average value of 121.86 with mean and standard deviation values of 121.86±66.65, TDS values range from 17.17 to 78.57(mg/l) with average value of 46.52(mg/l) with mean and standard values of 46.52±27.58, Na+ values ranges from 0.73 to 2.61(mg/l) with average value of 1.482(mg/l) with mean and standard deviation values of 1.482±0.716, Ca2+ values range from 2.14 to 4.486(mg/l) with average value of 4.486(mg/l) with mean and standard deviation values of 4.486±1.88, Mg2+ values ranges from 1.35 to 5.37(mg/l) with average value of 3.102(mg/l) with mean and standard deviation value of 3.102±1.69, Cl- values range from 36.44 to 71.6(mg/l) with average value of 53.85(mg/l) with mean and standard deviation values of 53.85±17.55, NO3- values range from 0.60 to 2.19(mg/l) with average value of 1.17(mg/l) with mean and standard deviation values of 1.17±0.68, HNO3- values ranges from 0.28 to 0.50(mg/l) with average value of 0.39(mg/l) with mean and standard deviation values of 0.394±0.090, SO4- values range from 0.08 to 0.22(mg/l) with average value of 0.12(mg/l) with mean and standard deviation values of 0.124±0.056, Cr2- values range from 0.08 to 0.22(mg/l) with average value of 0.031(mg/l) with mean and standard values of 0.0312±0.015, Cd- values range from 0.007 to 0.02(mg/l) with average value of 0.027 with mean and standard deviation values of 0.0268±0.038, Ni- values range from 0.03 to 0.014(mg/l) with average value of 0.0074(mg/l) with mean and standard deviation values of 0.0074±0.0041 and Pb2+ values range from 0.08 to 0.018(mg/l) with average value of 0.016(mg/l) with mean and standard deviation values of 0.0158±0.0091 as shown in Table 1 and 2, Figure 3,4 and 5.
The biological parameters analysed are Coliform and E. Coli, their values range from 1.1 X10³ to 2.2 X10³ with average value of 1.36 X10³ and 1.0 X10³ to 1.3 X10³ with average value of 1.06 X10³ as shown in Table 1.
Water sample 1 and 2 (AH and BCH) are collected around the Oluku dumpsite (Otofure area). From (Table 1 and 2) the pH values are 5.23 and 5.37 which is below the WHO (2011) and NSWQ (2007) standard permissible limit of 6.5 to 8.5. The pH of the samples ranges from 5.2-5.5 which less than the recommendation for potable water, it is observed that the study area is slightly acidic which is due to the presence of dissolved CO2 and or organic acids formed by decay of organic matters (Odukuma-Alonge, 2019). This acidic nature of the water samples can cause plumbing pipes to rust or corrode. EC values are 157.07 and 201.18(μS/cm) which conform with the WHO (2011) and NSWQ (2007) standard permissible limit of 1000μS/cm. TDS values are 78.57 and 25.19(mg/l) which conform with the WHO and NSWQ standard permissible limit 1000mg/l. Na+ values are 2.61 and 1.12 (mg/l) which conform with the WHO (2011) and NSWQ (2007) standard permissible limit of 200mg/l. Ca2+ values are 6.59 and 2.95(mg/l) which conform with the WHO (2011) and NSWQ (2007) standard permissible limit of 75mg/l and 150mg/l. Mg2+ values are 5.37 and 1.529(mg/l) which conform with the WHO standard permissible limit of 50mg/l but above the NSWQ standard permissible limit of 0.2mg/l. Cl- values are 71.6 and 36.5(mg/l) which conform with the WHO (2011) and NSWQ (2007) standard permissible limit of 200mg/l and 250mg/l. Nitrate values are 2.187 and 0.713mg/l which conform with the WHO (2011) and NSWQ (2007) standard permissible limit of 45mg/l and 50mg/l. Nitric acid values are 0.50 and 0.36mg/l which conform with the WHO (2011) and NSWQ (2007) standard permissible limit of 50mg/l. Sulfate values are 0.22 and 0.09mg/l which conform with the WHO (2011) and NSWQ(2007) standard permissible limit of 200mg/l and 100mg/l. Cr2- values are 0.053 and 0.03mg/l which conform with the WHO and NSWQ standard permissible limit of 0.05mg/l. Cd- values are 0.02 and 0.007mg/l is above the WHO (2011) and NSWQ (2007) standard permissible limit of 0.003. The source of cadmium in the water samples may be from plastics, tyres, condemn lubricating oil and used battery from dumpsite. The presence of cadmium in water for drinking can cause adverse effect on human kidney. Ni- values are 0.014 and (0.007mg/l) which conform with the WHO (2011) and NSWQ 2007 standard permissible limit of 0.07mg/l and 0.02mg/l. Pb2+ values are 0.028 and 0.01mg/l which above the WHO (2011) standard permissible limit of 0.004 but sample 2 conform with the NSWQ (2007) expect sample 1 which above permissible limit of 0.01mg/l as shown in Table 1 and 2, Figure 3,4 and 5.
The E. Coli values are 1.2 X 10³ and 2.2 X 10³ (cfu/100mL) which is above the WHO (2011) and NSWQ (2007) standard permissible limit of 0(cfu/100mL) and Total Coliform values are 1.0 X 10³ and 1.3 X 10³ (cfu/mL) which conform with the WHO (2011) and NSWQ 2007 standard permissible limit of 10(cfu/mL) as shown in Table 1. E. Coli being a member of the total coliform group is found exclusively in the faeces of humans and animals and its presence in water indicates not only faecal contamination of water but also the presence of intestinal disease –causing organisms (Health Canada, 2006). The presence of Coliform in the water samples is an indication of faecal contamination with the groundwater in the study area. A number of factors could be attributed to the high level of contamination of groundwater in the study area which ranges from lack of barrier effect (WHO 2011). and once the protective barrier effect is breached, direct contamination may occur to the construction of groundwater sources downhill and close to sanitation facilities as well as surface water (Odukuma-Alonge, 2019). The high level of microbial counts in the area may also be connected to the dumpsite in the area (Unanam, V, 2018) and the rugged topography of the area. Most probably during heavy rains, surface run-off penetrates the ground, accumulates and contaminates the groundwater overtime, hence, the degree of microbial contamination (Odukuma-Alonge, 2019).
Water sample 3 and 4 (NJ and PB) are collected around flood prone area (around Tomlin area). From (Table 1 and 2 the pH values are 4.43 and 5.1 which is below the WHO (2011) and NSWQ (2007) standard permissible limit of 6.5 to 8.5 and this indicate that the water samples are slightly acidic. This acidic nature of the water samples can cause plumbing pipes to rust or corrode. EC values are 74.03 and 142(μS/cm) which conform with the WHO (2011) and NSWQ (2007) standard permissible limit of 1000μS/cm. TDS values are 40.31 and 71.37(mg/l) which conform with the WHO and NSWQ standard permissible limit 1000mg/l. Na+ values are 1.27 and 1.68 (mg/l) which conform with the WHO (2011) and NSWQ (2007) standard permissible limit of 200mg/l. Ca2+ values are 3.36 and 3.91 (mg/l) which conform with the WHO (2011) and NSWQ (2007) standard permissible limit of 75mg/l and 150mg/l. Mg2+ values are 4.99 and 5.76(mg/l) which conform with the WHO standard permissible limit of 50mg/l but above the NSWQ standard permissible limit of 0.2mg/l. Cl- values are 53.08 and 71.59(mg/l) which conform with the WHO (2011) and NSWQ (2007) standard permissible limit of 200mg/l and 250mg/l. Nitrate values are 0.78 and 1.57mg/l which conform with the WHO (2011) and NSWQ (2007) standard permissible limit of 45mg/l and 50mg/l. Nitric acid values are 0.36and 0.47(mg/l) which conform with the WHO (2011) and NSWQ (2007) standard permissible limit of 50mg/l. Sulfate values are 0.11 and 0.12mg/l which conform with the WHO (2011) and NSWQ(2007) standard permissible limit of 200mg/l and 100mg/l. Cr2- values are 0.026 and 0.035(mg/l) which conform with the WHO and NSWQ standard permissible limit of 0.05mg/l. Cd- values are 0.006 and 0.0094(mg/l) is above the WHO (2011) and NSWQ (2007) standard permissible limit of 0.003. The source of cadmium in the water samples may be from plastics, tyres, condemn lubricating oil and waste water from runoff after heavy rainfall. The presence of cadmium in water for drinking can cause adverse effect on human kidney. Ni- values are 0.006 and 0.007(mg/l) which conform with the WHO (2011) and NSWQ 2007 standard permissible limit of 0.07mg/l and 0.02mg/l. Pb2+ values are 0.01 and 0.023(mg/l) which above the WHO (2011) standard permissible limit of 0.004 but sample 3 conform with the NSWQ (2007) expect sample 4 which above permissible limit of 0.01mg/l as shown in Table 1 and 2, Figure 3,4 and 5.
The E. Coli values are 1.2 X 10³ and 1.1 X 10³ (cfu/100mL) which is above the WHO (2011) and NSWQ (2007) standard permissible limit of 0 (cfu/100mL) and Total Coliform values are 1.0 X 10³ and 1.0 X 10³ (cfu/mL) which conform with the WHO (2011) and NSWQ 2007 standard permissible limit of 10(cfu/mL) as shown in Table 1. E. Coli being a member of the total coliform group is found exclusively in the faeces of humans and animals and its presence in water indicates not only faecal contamination of water but also the presence of intestinal disease –causing organisms (Health Canada, 2006). The presence of Coliform in the water samples is an indication of faecal contamination with the groundwater in the study area.
Water sample 5(GL) was collected around the department of geology. From (Table 1 and 2) the pH values are 4.3 which is below the WHO (2011) and NSWQ (2007) standard permissible limit of 6.5 to 8.5 and this indicate that the water samples are highly acidic. This acidic nature of the water sample can cause plumbing pipes to rust or corrode. EC value is 35.01μS/cm which conform with the WHO (2011) and NSWQ (2007) standard permissible limit of 1000μS/cm. TDS value is 17.17mg/l which conform with the WHO and NSWQ standard permissible limit 1000mg/l. Na+ value is 0.73mg/l which conform with the WHO (2011) and NSWQ (2007) standard permissible limit of 200mg/l. Ca2+ value is 2.14 mg/l which conform with the WHO (2011) and NSWQ (2007) standard permissible limit of 75mg/l and 150mg/l. Mg2+ value is 1.35mg/l which conform with the WHO standard permissible limit of 50mg/l but above the NSWQ standard permissible limit of 0.2mg/l. Cl- value is 36.44mg/l which conform with the WHO (2011) and NSWQ (2007) standard permissible limit of 200mg/l and 250mg/l. Nitrate value is 0.60mg/l which conform with the WHO (2011) and NSWQ (2007) standard permissible limit of 45mg/l and 50mg/l. Nitric acid value is 0.28mg/l which conform with the WHO (2011) and NSWQ (2007) standard permissible limit of 50mg/l. Sulfate value is 0.08mg/l which conform with the WHO (2011) and NSWQ(2007) standard permissible limit of 200mg/l and 100mg/l. Cr2- value is 0.012mg/l which conform with the WHO and NSWQ standard permissible limit of 0.05mg/l. Cd- value is 0.007mg/l is above the WHO (2011) and NSWQ (2007) standard permissible limit of 0.003. The source of cadmium in the water samples may be from plastics, tyres, condemn lubricating oil and waste water from runoff after heavy rainfall. The presence of cadmium in water for drinking can cause adverse effect on human kidney. Ni- value is 0.003(mg/l) which conform with the WHO (2011) and NSWQ 2007 standard permissible limit of 0.07mg/l and 0.02mg/l. Pb2+ value is 0.008mg/l which above the WHO (2011) standard permissible limit of 0.004 but conform with the NSWQ (2007) permissible limit of 0.01mg/l. The E. Coli value is 1.1 X1 03 (cfu/100mL) which is above the WHO (2011) and NSWQ (2007) standard permissible limit of 0 (cfu/100mL) and Total Coliform value is 1.0 X 10³ (cfu/mL) which conform with the WHO (2011) and NSWQ 2007 standard permissible limit of 10(cfu/mL). E. Coli being a member of the total coliform group is found exclusively in the faeces of humans and animals and its presence in water indicates not only faecal contamination of water but also the presence of intestinal disease –causing organisms (Health Canada, 2006). The presence of Coliform in the water samples is an indication of faecal contamination with the groundwater in the study area.
The results analysed from the three-study area reveals that the physiochemical parameters and microbiological parameters show similar trend. Water sample (sample 5 GL) collected in the premises of University of Benin has the least parameters concentration expect pH and water sample (sample 1 AH) from the dumpsite area has the highest parameters concentration. This is due to leachate from the dumpsite, anthropogenic activities and runoff from waste water from drainage and sewage septic tank. The water sample collected in the premises of University of Benin is more acidic compare to other water samples from the other locations. This probably due to the presence of decayed organic matter in high amounts and mineral acids produced during hydrolysis.
Table 1: Showing Physiochemical parameters, Major Cation, Major Anions and Microbiological parameters
Physiochemical parameters of Water Samples | |||||||||
S/N | Parameters / Location | Sample 1 AH | Sample 2 BCH | Sample 3 NJ | Sample 4 PB | Sample 5 GL | ACV | WHO (2011) | NSWQ (2007) |
1 | pH | 5.23 | 5.37 | 4.43 | 5.1 | 4.3 | 4.89 | 6.5-8.5 | 6.5-8.5 |
2 | EC (μS/cm) | 157.07 | 201.18 | 74.03 | 142 | 35.01 | 121.86 | 1000 | 1000 |
3 | TDS (mg/l) | 78.57 | 25.19 | 40.31 | 71.37 | 17.17 | 46.52 | 1000 | 500 |
Major Cations and Anions of Water Samples | |||||||||
4 | Na+(mg/l) | 2.61 | 1.12 | 1.27 | 1.68 | 0.73 | 1.48 | 200 | 200 |
5 | Ca2+(mg/l) | 6.59 | 2.95 | 4.99 | 5.76 | 2.14 | 4.49 | 75 | 150 |
6 | Mg2+(mg/l) | 5.37 | 1.52 | 3.36 | 3.91 | 1.35 | 3.10 | 50 | 0.2 |
7 | Cl-(mg/l) | 71.6 | 36.56 | 53.08 | 71.59 | 36.44 | 53.85 | 200 | 250 |
8 | NO3-(mg/l) | 2.187 | 0.713 | 0.78 | 1.57 | 0.60 | 1.17 | 45 | 50 |
9 | HNO3-(mg/l) | 0.50 | 0.36 | 0.36 | 0.47 | 0.28 | 0.39 | 50 | 50 |
10 | SO4-(mg/l) | 0.22 | 0.09 | 0.11 | 0.12 | 0.08 | 0.12 | 200 | 100 |
11 | Cr2-(mg/l) | 0.053 | 0.03 | 0.026 | 0.035 | 0.012 | 0.031 | 0.05 | 0.05 |
12 | Cd-(mg/l) | 0.02 | 0.007 | 0.006 | 0.094 | 0.007 | 0.027 | 0.003 | 0.003 |
13 | Ni-(mg/l) | 0.014 | 0.007 | 0.006 | 0.007 | 0.003 | 0.0074 | 0.07 | 0.02 |
14 | Pb2+-(mg/l) | 0.028 | 0.01 | 0.01 | 0.023 | 0.008 | 0.016 | 0.004 | 0.01 |
Microbiological Parameters of Water Samples | |||||||||
15 | E. Coli (cfu/100mL) | 1.2 X10³ | 2.2 X10³ | 1.2 X10³ | 1.1 X10³ | 1.1 X10³ | 1.36 X10³ | 0 | 0 |
16 | Coliform (cfu/mL) | 1.0 X10³ | 1.3 X10³ | 1.0 X10³ | 1.0 X10³ | 1.0 X10³ | 1.06 X10³ | 10 | 10 |
Table 2: Showing Physiochemical parameters, Major Cation and Major Anions with Statistical parameters
| Physiochemical parameters of Water Samples | |||||||||||
S/N | Parameters / Location | Sample 1 AH | Sample 2 BCH | Sample 3 NJ | Sample 4 PB | Sample 5 GL | Min | Max | Mean | STD. DEV. | ||
1 | pH | 5.23 | 5.37 | 4.43 | 5.1 | 4.3 | 4.3 | 5.37 | 4.89 | 0.49 | ||
2 | EC (μS/cm) | 157.07 | 201.18 | 74.03 | 142 | 35.01 | 35.01 | 201.18 | 121.86 | 66.65 | ||
3 | TDS (mg/l) | 78.57 | 25.19 | 40.31 | 71.37 | 17.17 | 17.17 | 78.57 | 46.52 | 27.38 | ||
| Major Cations and Anions of Water Samples | |||||||||||
4 | Na+(mg/l) | 2.61 | 1.12 | 1.27 | 1.68 | 0.73 | 0.73 | 2.61 | 1.482 | 0.716 | ||
5 | Ca2+(mg/l) | 6.59 | 2.95 | 4.99 | 5.76 | 2.14 | 2.14 | 6.59 | 4.486 | 1.88 | ||
6 | Mg2+(mg/l) | 5.37 | 1.52 | 3.36 | 3.91 | 1.35 | 1.35 | 5.37 | 3.102 | 1.69 | ||
7 | Cl-(mg/l) | 71.6 | 36.56 | 53.08 | 71.59 | 36.44 | 36.44 | 71.6 | 53.854 | 17.55 | ||
8 | NO3-(mg/l) | 2.187 | 0.713 | 0.78 | 1.57 | 0.60 | 0.6 | 2.187 | 1.17 | 0.68 | ||
9 | HNO3-(mg/l) | 0.50 | 0.36 | 0.36 | 0.47 | 0.28 | 0.28 | 0.5 | 0.394 | 0.090 | ||
10 | SO4-(mg/l) | 0.22 | 0.09 | 0.11 | 0.12 | 0.08 | 0.08 | 0.22 | 0.124 | 0.056 | ||
11 | Cr2-(mg/l) | 0.053 | 0.03 | 0.026 | 0.035 | 0.012 | 0.012 | 0.053 | 0.0312 | 0.015 | ||
12 | Cd-(mg/l) | 0.02 | 0.007 | 0.006 | 0.094 | 0.007 | 0.006 | 0.094 | 0.0268 | 0.038 | ||
13 | Ni-(mg/l) | 0.014 | 0.007 | 0.006 | 0.007 | 0.003 | 0.003 | 0.014 | 0.0074 | 0.0041 | ||
14 | Pb2+(mg/l) | 0.028 | 0.01 | 0.01 | 0.023 | 0.008 | 0.008 | 0.028 | 0.0158 | 0.0091 | ||
The results analysed from the three-study area reveals that the physiochemical parameters and microbiological parameters show similar trend. Water sample (sample 5 GL) collected in the premises of University of Benin has the least parameters concentration expect pH and water sample (sample 1 AH) from the dumpsite area has the highest parameters concentration. This is due to leachate from the dumpsite, anthropogenic activities and runoff from waste water from drainage and sewage septic tank. The water sample collected in the premises of University of Benin is more acidic compare to other water samples from the other locations. This probably due to the presence of decayed organic matter in high amounts and mineral acids produced during hydrolysis.
I recommend that flood control measure should be put in place in the flood prone area namely: desilting of drainage; drainage network, creation of canals, proper land use planning and flood insurance should be setup for those that will lose their properties to flood. I also want to recommend that water from the study areas should be treated first before drinking and proper monitoring and waste management should be carried out around the dumpsite area.