
Research Article | DOI: https://doi.org/10.58489/2836-3590/017
1Directorate of Strategy, Research and Development, Maritime Academy of Nigeria, Oron, Akwa Ibom State.
*Corresponding Author: Mfon David Umoh*
Citation: Mfon David Umoh, Udoh F. Evans, Clement Utting. (2024). Air Quality Index Prediction Using Machine Learning Algorithms for Certain Locations in Nigeria. Pollution and Effects on Community Health. 3(1). DOI: 10.58489/2836-3590/017
Copyright: © 2024 Mfon David Umoh, this is an open-access article distributed under the Creative Commons Attribution License, which permits unrestricted use, distribution, and reproduction in any medium, provided the original work is properly cited.
Received: 14 July 2023 | Accepted: 16 January 2024 | Published: 15 March 2024
Keywords: Air; Modelling; AQI; Temperature; Humidity.
Prediction of air quality index for certain locations in Nigeria has been carried out. The data used for this research was gotten from purple air data web site. The locations selected are; University of Ibadan, Edo Broadcasting station, Kogi, Nimet, Benin, Lekki phase1 in Lagos and Space center, Kebbi. Air quality Index was calculated based on PM2.5 data obtained from the purple air website. The other variables obtained are PM10, PM1, Temperature and Humidity. The machine learning algorithms used for modelling are linear regression, support vector machines (SVM), K-Nearest Neighbors (KNN), and regression trees. These algorithms were obtained using R programming language. The results show that for University of Ibadan station. AQI increased towards the end of 2021 up till the end of February 2022. There was a steady decrease in AQI towards the end of May 2022. For Edo Broadcasting station, AQI increased towards the end of 2021 up till the end of February 2022. There was a steady decrease in AQI towards the end of May 2022. There was an increase after May 2022. For Kogi station, AQI increased towards the end of October 2021 up till the end of February 2022. There was a steady decrease in AQI in April 2022. For Lekki phase 1, Lagos station, AQI increased from April 2021 towards the end of December 2021. There was a steady decrease in AQI towards the end of April 2022. For Nimet, Benin station, AQI increased steadily from October 2021 up till the end of February 2022. There was a steady decrease in AQI towards the end of April 2022 and a slight increase in May 2022. For Space center, Kebbi station, AQI decreased steadily from August 2021 up till the end of February 2022. There was a steady increase of AQI in March 2022 and a slight decrease in May 2022. AQI shows that the quality of air in Ibadan was classified as good, Edo broadcasting and Nimet, Benin were unhealthy for sensitive groups while Kogi, Space center Kebbi and Lagos were classified as moderate. Modelling result shows that of all the machine learning model selected for this research work, K-nearest neighbors was found to be the best model for the prediction of AQI across Nigeria. This is because it had the smallest value for the errors. Hence for the prediction of AQI in Nigeria, KNN is recommended.
One of the essential ingredients for all earthly life is air. Because of urbanization, industrialization, automobiles, power plants, chemical activities, and other human-made activities, pollution has increased during the past 50 years. All of these activities, especially particulate matter (PM), contribute to the growth of pollution (Doreswamy et al., 2020). PM2.5, or fine particulate matter, is the term used to describe airborne particles having an aerodynamic dimension of less than 2.5 micrometers and is the element of air pollution that has received the most research. Given their ability to cross biological membranes, deeply enter the respiratory system, and harm the entire body, these particles are especially dangerous. Mortality, cardiovascular, cerebrovascular, respiratory, neurological, etc. effects have all been linked to exposure to PM2.5 (Zeng et al., 2020).
A serious environmental risk to human health is now air pollution. Studies show a direct link between air pollution exposure and the severity of major illnesses like heart disease, cancer, and asthma attacks. Ozone, sulfur dioxide, nitrogen dioxide, and particulate matter with an aerodynamic diameter of less than 2.5 m (PM2.5) are examples of air pollutants (Aldaweesh, 2020). Exposure assessment concerns have been addressed in environmental research for a long time, especially in studies involving air contaminants. The quantity of people who may be enrolled in studies and the duration of exposures that can be measured are both effectively constrained by direct individual assessments utilizing personal monitors, which are expensive, challenging to deploy, and uncomfortable for participants. Some monitors also have significant exposure measurement bias. However, the information provided by monitors that are positioned in the center has both geographical and temporal limitations. By utilizing these, we would be able to investigate fewer individuals and geographical regions, raise uncertainty, and potentially inject bias into health effect estimates. Modeling exposures provides a remedy for these shortcomings (Yazdi et al., 2020). Many individuals are attempting to apply Artificial Intelligence (AI) algorithms (machine learning, deep learning), which can produce superior results, given that standard air quality prediction methods require greater processing capacity for the calculation of pollutant concentration. Machine learning techniques are becoming more popular for predicting non-linear time series data, such as weather and pollution data. A computer is taught to build a model using training data using a data technique called machine learning (ML). It is a branch of artificial intelligence that makes it possible for computer programs to make increasingly accurate predictions of outcomes. ML can examine a variety of data and identify patterns and particular trends.(Dobrea et al., 2020).
To estimate the ground-level PM2.5 concentrations over Dhaka, Reza et al. (2023) provided the best subset regression model and machine learning methodologies, such as random tree, additive regression, reduced error pruning tree, and random subspace. The influence of climatic variables and air pollutants (NOX, SO2, CO, and O3) on the dynamics of PM2.5 in Dhaka from 2012 to 2020 were assessed using cutting-edge machine learning methods. As a result of integrating precipitation, relative humidity, temperature, wind speed, SO2, NOX, and O3 into the forecasting of PM2.5 concentrations for all sites, the results demonstrated that the best subset regression model was successful.
A PM 2.5 forecasting model employing the Long Short-Term Model (LSTM) sequence to sequence in combination with the statistical method was proposed by Lan and Nguyen in 2021. To choose the key features, XGBoost, correlation analysis, and chemical processing were employed as the methodologies. The air pollution data for Taichung City were taken from the Taiwan Environmental Protection Agency (EPA) dataset between 2014 and 2018. According to the study, among the other models, the chemically processed models of particulate matter with a diameter of less than 10 micrometers (PM10), sulfur dioxide (SO2), and nitrogen dioxide (NO2) had the best accuracy or the lowest Root Mean Square Error (RMSE) and required less time for training and testing. The PM10, SO2, and NO2 chemically treated model (model B) achieved the highest accuracy (lowest RMSE), about 1 point less.
The XGBoost (Extreme Gradient Boosting) algorithm was used by Bingyue (2018) to forecast hourly PM2.5 concentration. The XGBoost algorithm was used to assess the air quality monitoring data for the city of Tianjin. Using three measures of forecast accuracy, the prediction performance of the XGBoost technique was assessed by comparing the observed and anticipated PM2.5 concentration. Using computational findings, the XGBoost technique was compared to the random forest algorithm, multiple linear regression, decision tree regression, and support vector machines for regression models. The outcomes show that the XGBoost algorithm performs better than other data mining techniques.
In order to predict/forecast the Air Quality and Pollution in specific places, Devasekhar & Natarajan (2023) suggested an effective combination technique that utilizes the advantages of statistical techniques and machine learning techniques. Additionally, this research demonstrated that prediction accuracy differs between Indian cities and regions. The yearly PM 2.5 concentration levels in several sites throughout Hyderabad were predicted using time series analysis, regression, and Ada boosting, depending on a variety of atmospheric and surface characteristics like wind speed, air temperature, pressure, and so on. The dataset used for this inquiry was obtained from Kaggle, and the proposed method was tested, followed by comparison findings of our trials.
Sanjeev, 2021, investigated the application of Random Forest (RF), Support Vector Machine (SVM), and Artificial Neural Networks (ANN) machine learning methods. This research shows how air quality may be analyzed and predicted using machine learning methods. The outcome showed that the suggested approaches were trustworthy and efficient. The accuracy ratings of the Random Forest-based model, Support Vector Machine, and Artificial Neural Network were 90.4%, 93.5%, and 99.4%, respectively. The Random Forest method was the best air quality prediction method out of the three.
Materials and Method
The data used for this study was obtained from the purple air website using python programming language. The cities considered for the study include Anyingba, Kogi state with latitude 7o 15’N and longitude 7o 11’E. Ibadan, Oyo state with latitude 7o 24’47’’N and longitude 3o 55’0’’E. Edo state with latitude 7o 04’N and longitude 6o 16’E. Lekki, Lagos state with latitude 6o 29’36’’N and longitude 3o 43’14’’E and Kebi, Kebi state with latitude 11o 30’47’’N and longitude 4o 00’E. The data covered a period of one year (April 2021 to April 2022). Machine learning algorithms used for this work are: K-Nearest neighbors, decision trees, deep learning and support vector machines. These algorithms were used from R programming language. Visualizations were done using Tableau software together with python.
The cities considered for the study include: Anyingba, Kogi state is located at latitude 7o 15’N and longitude 7o 11’E. The city has an area of 420km2 with a population of 189, 976 inhabitants. Ibadan, Oyo state with latitude 7o 24’47’’N and longitude 3o 55’0’’E. The city has an area of 6800km2 with a population of 3,649,000 inhabitants. Auchi, Edo state with latitude 7o 04’N and longitude 6o 16’E. The city has an area of 755km2 with a population of 500,000 inhabitants. Lekki, Lagos state with latitude 6o 29’36’’N and longitude 3o 43’14’’E. The city has an area of 755km2 with a population of 401,270 inhabitants. and Kebi, Kebi state with latitude 11o 30’47’’N and longitude 4o 00’E. The city has an area of 36,800km2 with a population of 3,256,541 inhabitants.
Categorization of AQI
Air quality index based on the individual pollutants
AQI for the four pollutants were calculated by using equation 1 below. The equation is used to calculate the AQI of a location based on the measured concentration of a particular pollutant. Ip is the AQI that is to be calculated based on the pollutant. Cp is the concentration of the pollutant rounded to a reasonable decimal. BPHi is the breakpoint that is greater than or equal to the rounded concentration of the pollutants. BPLo is the breakpoint that is less than or equal to the rounded concentration of the pollutant Cp. IHi is the AQI value that corresponds to BPHi. While ILo is the AQI value that corresponds to BPLo. The measured concentration of the four pollutants were used in the computation of the AQI. The AQI was based on the breakpoints published by the United State Environmental Protection Agency (USEPA) published in 2006. These breakpoints are presented in table 1. The average of the AQI for each point was calculated to represent the AQI for the point.
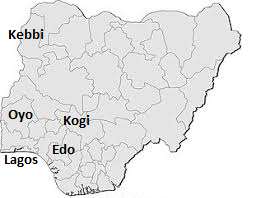
Fig 1: Map of Nigeria showing locations of study
AQI Equation

Where: IP = the index for pollutant P
CP = the rounded concentration of pollutant P
BPHi = the breakpoint that is greater than or equal to CP
BPLo = the breakpoint that is less than or equal to CP
IHi = the AQI value corresponding to BPHi
ILo = the AQI value corresponding to BPLo
Table 1: break points for the different pollutants
O3 (ppm) 8-hour | O3 (ppm) 1-hour | PM2.5 (µg/m3) | PM10 (µg/m3) | CO (ppm) | SO2 (ppm) | NO2 (ppm) | AQI | Category |
0.000– 0.064 | - | 0.0 – 15.4 | 0 – 54 | 0.0 – 4.4 | 0.00 – 0.034 | (2) | 0 -50 | Good |
0.065 – 0.084 | - | 15.5 – 40.4 | 55 – 154 | 4.5 – 9.4 | 0.035 – 0.144 | (2) | 51 – 100 | Moderate |
0.085 – 0.104 | 0.125 – 0.164 | 40.5 – 65.4 | 155 – 254 | 9.5 -12.4 | 0.145 – 0.224 | (2) | 101 – 150 | Unhealthy For sensitive groups |
0.105 – 0.124 | 0.165 – 0.204 | 65.5 – 150.4 | 255 – 354 | 12.5 – 15.4 | 0.225 – 0.304 | (2) | 151 – 200 | Unhealthy |
0.125 – 0.374 | 0.205 – 0.404 | 150.5 – 250.4 | 355 – 424 | 15.5 – 30.4 | 0.305 – 0.604 | 0.65 – 1.24 | 201 – 300 | Very unhealthy |
| (3) | 0.405 – 0.504 | 250.5 – 350.4 | 425 – 504 | 30.5 – 40.4 | 0.605 – 0.804 | 1.25 – 1.64 | 301 – 400 | Hazardous |
| (3) | 0.505 – 0.604 | 350.5 – 500.4 | 505 - 604 | 40.5 – 50.4 | 0.805 – 1.004 | 1.65 – 2.04 | 401 - 500 | Hazardous |
NOTE: N02 has no short-term NAAQS and can generate an AQI only above a value of 200.
For Ibadan
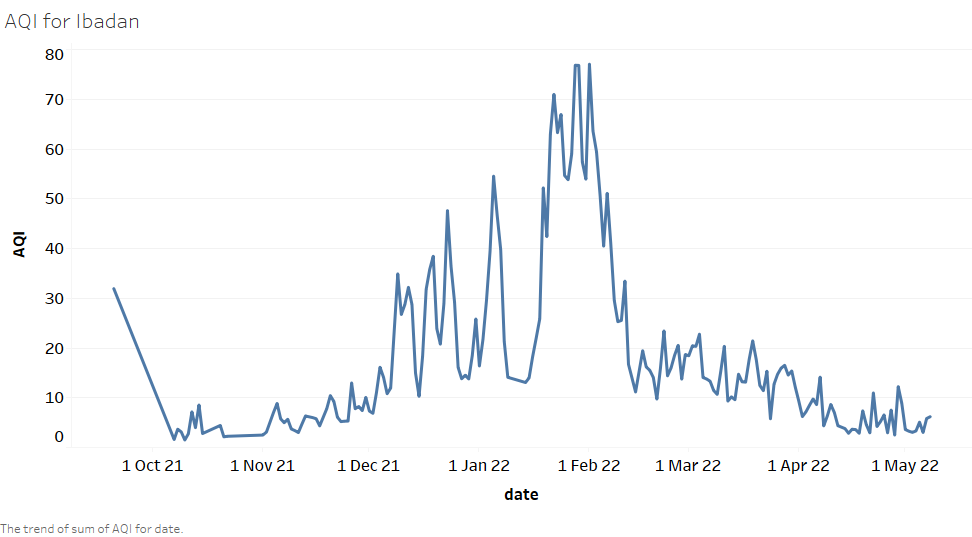
Fig 2. shows the seasonal plot of air quality index (AQI) for University of Ibadan station. From the graph, it can be seen that AQI increased towards the end of 2021 up till the end of February 2022. There was a steady decrease in AQI towards the end of May 2022.
For Edo Broadcasting Station

Fig 3. shows the seasonal plot of air quality index (AQI) for Edo Broadcasting station. From the graph, it can be seen that AQI increased towards the end of 2021 up till the end of February 2022. There was a steady decrease in AQI towards the end of May 2022. There was an increase after May 2022
For Kogi

Fig 4. shows the seasonal plot of air quality index (AQI) for Kogi station. From the graph, it can be seen that AQI increased towards the end of October 2021 up till the end of February 2022. There was a steady decrease in AQI in April 2022.
Lekki phase1, Lagos

Fig 5. shows the seasonal plot of air quality index (AQI) for Lekki phase 1, Lagos station. From the graph, it can be seen that AQI increased from April 2021 towards the end of December 2021. There was a steady decrease in AQI towards the end of April 2022.
Nimet Benin

Fig 6. shows the seasonal plot of air quality index (AQI) for Nimet, Benin station. From the graph, it can be seen that AQI increased steadily from October 2021 up till the end of February 2022. There was a steady decrease in AQI towards the end of April 2022 and a slight increase in May 2022.
Space center, Kebbi
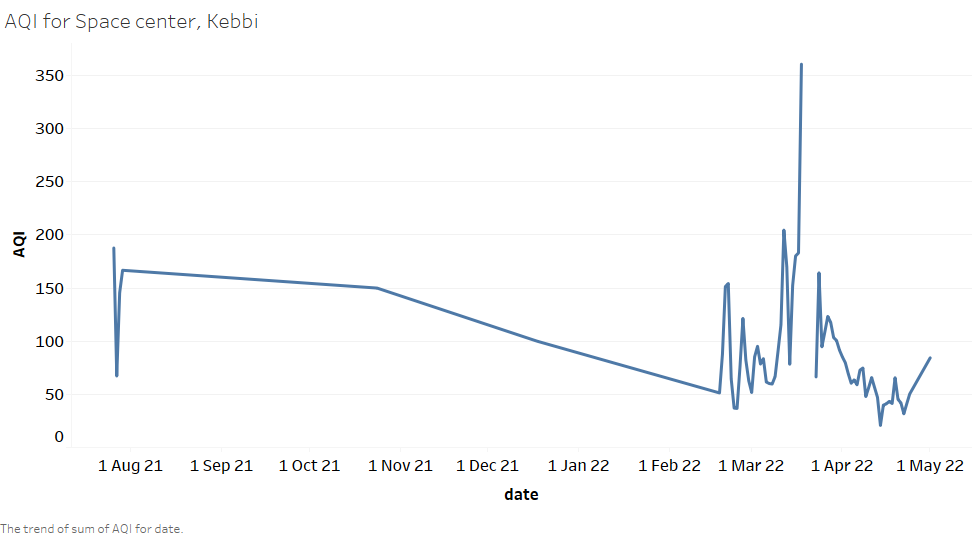
Fig 7. shows the seasonal plot of air quality index (AQI) for Space center, Kebbi station. From the graph, it can be seen that AQI decreased steadily from August 2021 up till the end of February 2022. There was a steady increase of AQI in March 2022 and a slight decrease in May 2022.
Table 2. AQI values for the study locations
| STATION | AQI | AQI CATEGORY |
| CAR Ibadan | 17.03 | Good |
| Edo Broadcasting | 135.31 | Unhealthy For sensitive groups |
| Kogi | 88.66 | Moderate |
| Lekki phase 1 | 57.45 | Moderate |
| Nimet, Benin | 135.90 | Unhealthy For sensitive groups |
| Space Center, Kebbi | 68.62 | Moderate |
Modelling
Machine learning models were developed to predict the gases under study. Machine learning algorithms used are linear regression (LR), K-nearest neighbors (K-NN), Regression trees (RT) and Support vector machines (SVM).
Model testing
The forecasting models are tested using the following errors; Root mean squared error (RMSE), mean absolute percentage error (MAPE).
MAE =

MPE =

RMSE =
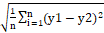
MAPE =

Where y1 is the actual of observed values and y2 is the forecasted values
RMSE is the root mean squared error, MPE is the mean percentage error, MAPE is the mean absolute percentage error and MAE is the mean absolute error. Since the MPE gives information on the long-term performance of the examined regression equation, a positive MPE value provides the average amount of overestimation in the calculated values while a negative MPE value gives underestimation (Akpabio, et al. 2004). On the whole, a low MPE is desirable. The test on RMSE conveys information on the short-term performance of the different equations since it enables a term-by-term comparison of the actual variations between the estimated and measured values. For more accurate estimation, lower values of RMSE should be obtained (Akpabio, et al. 2004).
For University of Ibadan station
Table 3. Model parameters for Ibadan station
| ML algorithms | RMSE | MAPE | MAE |
| LR | 1.74 | 76.02 | 991.68 |
| SVM | 2.22 | 112.72 | 1147.73 |
| KNN | 1.55 | 75.18 | 922.09 |
| RT | 2.52 | 157.56 | 1797.93 |
Table 3 shows model testing parameters for AQI prediction in University of Ibadan station. The root mean squared error (RMSE), mean absolute percentage error (MAPE), and mean absolute error (MAE) were used to test the models used for prediction of AQI. A very close look at the table shows that in terms of RMSE, KNN model had the best performance during prediction of AQI. In summary, KNN model had the best performance. This is because KNN had the least value in terms of RMSE, MAPE and MAE. We can conclude that to get the best prediction of AQI for Ibadan, KNN model should be used. The graph of measured and predicted values of hydrogen sulfide using KNN model is shown in fig 8.

Fig 8. AQI and predicted values using KNN model for Ibadan
For Edo Broadcasting Station
Table 4 Model parameters for Edo Broadcasting station
| ML algorithms | RMSE | MAPE | MAE |
| LR | 13.09 | 97.55 | 11551.72 |
| SVM | 8.70 | 37.32 | 4644.91 |
| KNN | 1.85 | 6.18 | 859.16 |
| RT | 11.73 | 89.77 | 10304.78 |
Table 4 shows model testing parameters for AQI prediction in Edo broadcasting station. The root mean squared error (RMSE), mean absolute percentage error (MAPE), and mean absolute error (MAE) were used to test the models used for prediction of AQI. A very close look at the table shows that in terms of RMSE, KNN model had the best performance during prediction of AQI. In summary, KNN model had the best performance. This is because KNN had the least value in terms of RMSE, MAPE and MAE. We can conclude that to get the best prediction of AQI for Ibadan, KNN model should be used. The graph of measured and predicted values of hydrogen sulfide using KNN model is shown in fig 9.
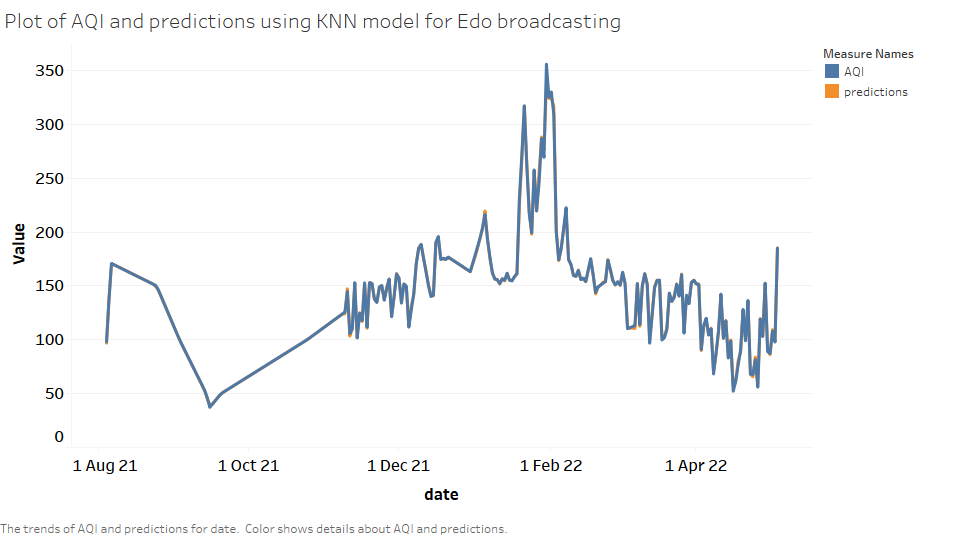
Fig 9. AQI and predicted values using KNN model for Edo Broadcasting
For Kogi station
Table 5. Model parameters for Kogi station
| ML algorithms | RMSE | MAPE | MAE |
| LR | 16.73 | 281.51 | 18756.75 |
| SVM | 10.27 | 116.76 | 5429.90 |
| KNN | 5.78 | 30.37 | 171164 |
| RT | 10.60 | 226.69 | 1181.54 |
Table 5 shows model testing parameters for AQI prediction in Kogi station. The root mean squared error (RMSE), mean absolute percentage error (MAPE), and mean absolute error (MAE) were used to test the models used for prediction of AQI. A very close look at the table shows that in terms of RMSE, KNN model had the best performance during prediction of AQI. In summary, KNN model had the best performance. This is because KNN had the least value in terms of RMSE, MAPE and MAE. We can conclude that to get the best prediction of AQI for Ibadan, KNN model should be used. The graph of measured and predicted values of hydrogen sulfide using KNN model is shown in fig 10.
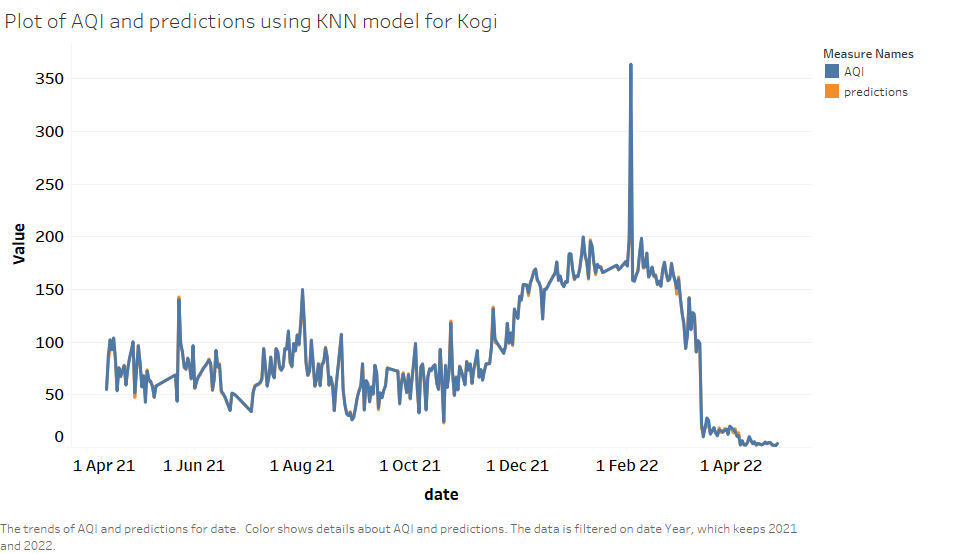
Fig 10. AQI and predictions using KNN model for Kogi
For Lekki phase 1, Lagos station
Table 6. Model parameters for Lekki phase 1, Lagos
| ML algorithms | RMSE | MAPE | MAE |
| LR | 69.88 | 786.82 | 71969.79 |
| SVM | 5.21 | 280.00 | 4332.63 |
| KNN | 1.26 | 90.93 | 976.78 |
| RT | 7.42 | 417.44 | 9572.17 |
Table 6 shows model testing parameters for AQI prediction in Lekki phase 1 station. The root mean squared error (RMSE), mean absolute percentage error (MAPE), and mean absolute error (MAE) were used to test the models used for prediction of AQI. A very close look at the table shows that in terms of RMSE, KNN model had the best performance during prediction of AQI. In summary, KNN model had the best performance. This is because KNN had the least value in terms of RMSE, MAPE and MAE. We can conclude that to get the best prediction of AQI for Ibadan, KNN model should be used. The graph of measured and predicted values of hydrogen sulfide using KNN model is shown in fig 11.
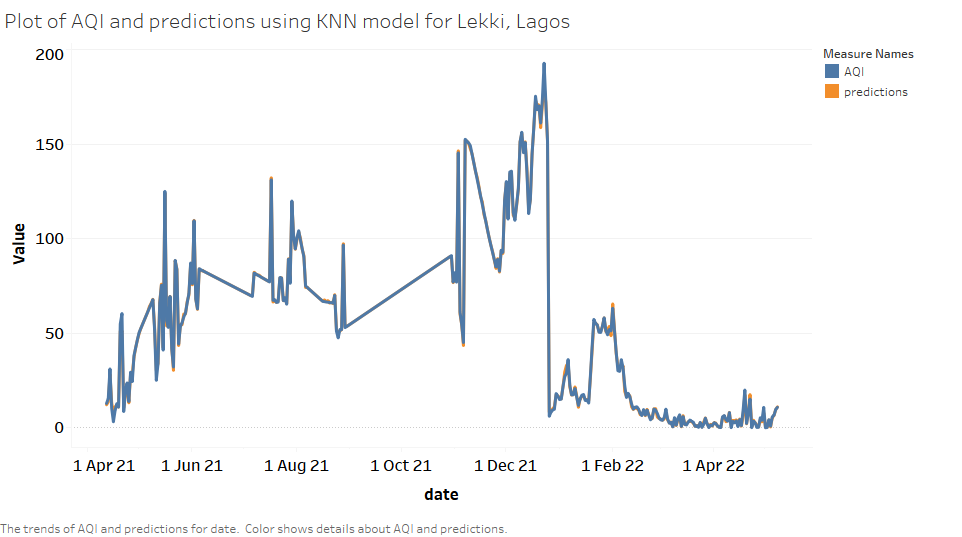
Fig 11. AQI and prediction using KNN model for Lekki, Lagos
For Nimet Benin station
Table 7. Model parameters for Nimet, Benin station
| ML algorithms | RMSE | MAPE | MAE |
| LR | 14.36 | 107.37 | 13117.23 |
| SVM | 6.70 | 28.06 | 3514.65 |
| KNN | 2.00 | 7.25 | 831.45 |
| RT | 8.76 | 63.93 | 7608.60 |
Table 7 shows model testing parameters for AQI prediction in Nimet Benin station. The root mean squared error (RMSE), mean absolute percentage error (MAPE), and mean absolute error (MAE) were used to test the models used for prediction of AQI. A very close look at the table shows that in terms of RMSE, KNN model had the best performance during prediction of AQI. In summary, KNN model had the best performance. This is because KNN had the least value in terms of RMSE, MAPE and MAE. We can conclude that to get the best prediction of AQI for Ibadan, KNN model should be used. The graph of measured and predicted values of hydrogen sulfide using KNN model is shown in fig 12.
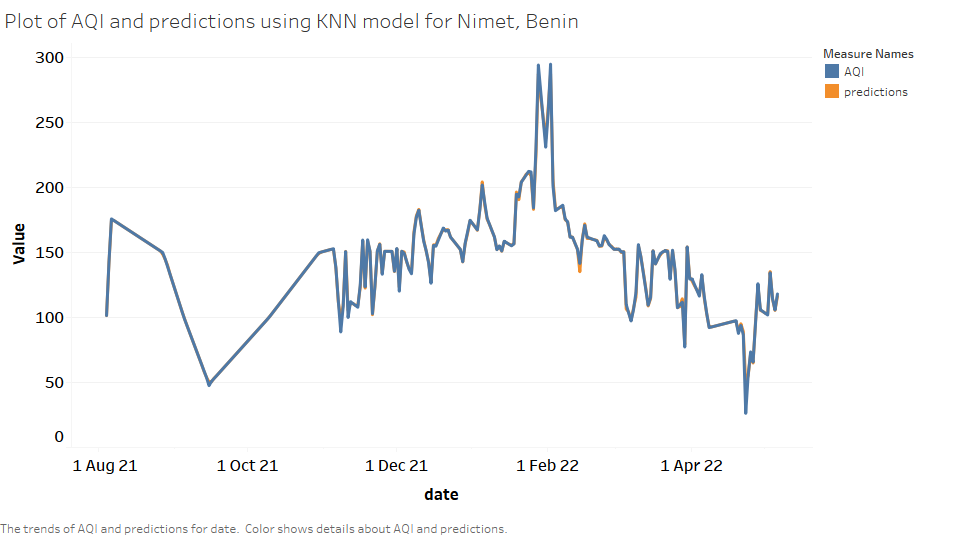
Fig 12. AQI and prediction using KNN model for Nimet, Benin
For space center Kebbi
Table 8. Model parameters for Space center, Kebbi
| ML algorithms | RMSE | MAPE | MAE |
| LR | 17.53 | 108.30 | 11107.15 |
| SVM | 15.73 | 63.67 | 6334.60 |
| KNN | 9.63 | 18.37 | 1807.42 |
| RT | 11.13 | 85.72 | 8107.66 |
Table 8 shows model testing parameters for AQI prediction in University of Ibadan station. The root mean squared error (RMSE), mean absolute percentage error (MAPE), and mean absolute error (MAE) were used to test the models used for prediction of AQI. A very close look at the table shows that in terms of RMSE, KNN model had the best performance during prediction of AQI. In summary, KNN model had the best performance. This is because KNN had the least value in terms of RMSE, MAPE and MAE. We can conclude that to get the best prediction of AQI for Ibadan, KNN model should be used. The graph of measured and predicted values of hydrogen sulfide using KNN model is shown in fig 13.

Fig 13. AQI and predictions using KNN model for Space center, Kebbi
Prediction of air quality index for certain locations in Nigeria has been carried out. The data used for this research was gotten from Purple air data web site. The locations selected are; University of Ibadan, Edo Broadcasting station, Kogi, Nimet, Benin, Lekki phase1 in Lagos and Space center, Kebbi. Air quality Index was calculated based on PM2.5 data obtained from the purple air website. The other variables obtained are PM10, PM1, Temperature and Humidity. The machine learning algorithms used for modelling are linear regression, support vector machines (SVM), K-Nearest Neighbors (KNN), and regression trees. These algorithms were obtained using R programming language. The results show that for University of Ibadan station. AQI increased towards the end of 2021 up till the end of February 2022. There was a steady decrease in AQI towards the end of May 2022. For Edo Broadcasting station, AQI increased towards the end of 2021 up till the end of February 2022. There was a steady decrease in AQI towards the end of May 2022. There was an increase after May 2022. For Kogi station, AQI increased towards the end of October 2021 up till the end of February 2022. There was a steady decrease in AQI in April 2022. For Lekki phase 1, Lagos station, AQI increased from April 2021 towards the end of December 2021. There was a steady decrease in AQI towards the end of April 2022. For Nimet, Benin station, AQI increased steadily from October 2021 up till the end of February 2022. There was a steady decrease in AQI towards the end of April 2022 and a slight increase in May 2022. For Space center, Kebbi station, AQI decreased steadily from August 2021 up till the end of February 2022. There was a steady increase of AQI in March 2022 and a slight decrease in May 2022. AQI shows that the quality of air in Ibadan was classified as good, Edo broadcasting and Nimet, Benin were unhealthy for sensitive groups while Kogi, Space center Kebbi and Lagos were classified as moderate. Modelling result shows that of all the machine lerning model selected for this research work, K-nearest neighbors was found to be the best model for the prediction of AQI across Nigeria. This is because it had the smallest value for the errors. Hence for the prediction of AQI in Nigeria, KNN is recommended.