Archive : Article / Volume 2, Issue 1
- Research Article | DOI:
- https://doi.org/10.58489/2836-3590/006
Suitability Assessment of Shallow Groundwater for Industrial Uses in Terms of Storability and Corrosivity
1Govt. HSS University College, Magura 6700, Ministry of Education, Bangladesh
2Institute of Environmental Science, University of Rajshahi, Rajshahi 6205, Bangladesh
Md. Shajedul Islam, Govt. HSS University College, Magura 6700, Ministry of Education, Bangladesh
Md. Shajedul Islam & M. G. Mostafa. Suitability Assessment of Shallow Groundwater for Industrial Uses in Terms of Storability and Corrosivity. J. Pollut. Eff. Community Health. Vol. 2 Iss. 1 (2023). DOI: 10.58489/2836-3590/006
© 2023 Md. Shajedul Islam. E, This is an open-access article distributed under the Creative Commons Attribution License, which permits unrestricted use, distribution, and reproduction in any medium, provided the original work is properly cited.
- Received Date: 15-12-2022
- Accepted Date: 27-12-2022
- Published Date: 16-01-2023
Carbonate saturation, Cooling water, Water quality indices, Aggressiveness, Corrosivity, Encrusting
Abstract
Maximum industry uses groundwater which is consumed for cooling, product treatment and cleaning, processing, boiler make-up, etc. To assess the industrial water quality, the groundwater samples were collected from pre-monsoon and post-monsoon periods and investigated some selected water parameters. The lower values of pH, Cl-, SO42-, CO32, and NO3-; and the higher levels of total dissolved solids, water hardness, total alkalinity, Ca2+, HCO3-, copper, and iron were the dominant chemical characteristics in the study area. This water chemistry proved that the circulated and feed cooling water have a less corrosive tendency, but it produced scale in equipment. Approximately 100% of the samples were less suitable for the wood, food, paper, and sugar industries, and about 85% of the samples were unsuitable for the canned fruit and polymer industries. The storability and corrosion potential of water were assessed using several indexes based on analyzed water parameters. The results revealed that the bicarbonate regulating index values of the samples indicated a moderate to strong corrosive nature, whereas there was a less scale-forming tendency for boiler use. The study observed the need to continually monitor the corrosion potentiality in industrial systems and conduct laboratory analysis to maintain water quality standards including pH, alkalinity, Ca2+, and HCO3- to control corrosion and scale generation.
Introduction
Water is the most valuable gift of nature and is vital for life-sustaining and economic development. It has become one of the greatest stressors in current years owing to the growing population, urbanization, agricultural diversity, and industrialization. The maximum number of industrial plants needed to use water in many practices. Water could be a raw material in the pharmaceutical product or food industry. It is said to be the common solvent, so water is used for diluting and dissolving, and it has a high specific heat capacity also, thus is suitable as a coolant for its capability to take in the excess heat that is generated by several industrial courses (Abrahão et al. 2007; Omeka et al. 2022). Around half of all industrial water is utilized for cooling systems (Zeid et al. 2018). In any industry, boilers are played to yield steam and hot or hyper-thermal water and this kind of water must be at least non-scale forming and non-corrosive in the boiler systems and the power generating equipment or heat exchange piping (Magara 2014; Philibert et al. 2017). Food or pharmaceutical industries produced products for direct human consumption and needed to use purified water free from all types of contaminants (Soroush et al. 2011). The amount of water a country needs for industrial activities differs widely and is low in most rural areas compared to a big city. A maximum of the water used in industrial processes enters the natural waters as wastewater, causing water pollution. However, water quality degradation depends on industrial processes and the chemicals used.
Heavy water-using industries can include chemicals, food, paper, tannery, refined petroleum, or primary metals. As stated by the United Nations World Water Development Report, the industrial sector uses an average of 22% of all global water extractions (Egbueri et al. 2022). It ranges from 59% to 8
Methods and materials
A total of 18 shallow aquifer water samples of the Kushtia municipality in the middle-western zone of Bangladesh were designated for this study during the pre-monsoon (PRM) and post-monsoon (POM) periods (Fig. 1). The average depth of these wells was 49 m. Based on the standard guideline of US-APHA (2005), the samples were collected and preserved for further analysis. The temperature, pH, and total dissolved solids (TDS) were counted in situ by the portable multimeter. Common anions such as Cl-, SO42-, and NO3- were measured by UV-spectrophotometer. Total alkalinity, total hardness (TH), Ca2+, CO32-, and HCO3- in water samples were measured by the traditional titrimetric method (Islam & Mostafa 2021c). The trace metals such as iron (Fe) and copper (Cu) were estimated by an atomic absorption spectrophotometer (AAS) (Islam & Mostafa 2022c). The values of the measured water variables are shown in Table1.
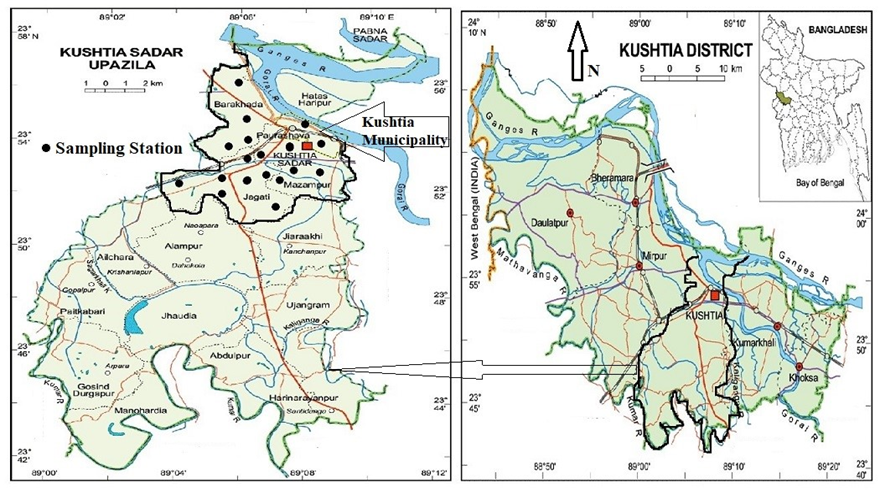
Figure1: Study area and sampling sites
Saturation Index (SI) and Mineral Solubility
The saturation index (SI) was used to evaluate the reactive mineralogy and identify the exact rock(s) source of the subsurface layers from the geochemical data of groundwater (Appelo & Postma 2005). An index value indicates whether water will tend to dissolve or precipitate a specific rock or mineral. This index is computed by comparing the chemical activities or ion activity product (IAP) of the dissolved ions that come from a mineral with their solubility product (Ksp) at a specific temperature (Eqs. 1 and 2). It was calculated using the computer software PHREEQC-3v for groundwater geochemistry (Parkhurst & Appelo 2013) which can be shown as:
Formula 1 & 2
In the case of calcite mineral dissolution, [A] and [B] are denoted as [Ca2+] and [CO32-] in Eqns. 1 and 2. The positive index value designates the supersaturation with minerals in water and a tendency for the mineral to precipitate from the water samples. While the negative value of SI pointed to undersaturation tends to the minerals to dissolve into water. The index values within a range of -0.5 to +0.5 for a particular mineral can be taken as behalf of apparent equilibrium mixing in groundwater, which designates the tendency of minerals neither to precipitate nor dissolve in groundwater (Srinivasamoorthy et al. 2013).
Industrial Water Quality Indices
The stability of industrial and pipeline-supply water was determined through the following scaling and corrosive indices (composed by Mirzabeygi et al. 2016; Aghazadeh et al. 2016; Abbasnia et al. 2018; Asghari et al. 2018; Kumar 2019; Omeka et al. 2022). The guideline value for each index and water categorization for industrial water quality are presented in Table 1.
Puckorius Scaling Index (PSI)
The PSI tries to measure the connection between scale formation and saturation state by adding an estimate of the buffering capacity of the water sample into the index. Water with high Ca2+ but low buffering capacity and total alkalinity could have elevated calcite (CaCO3) saturation level (Islam & Majumder 2020). The high Ca2+ concentration in water increases the ion activity product. Due to the low buffering capacity, a diagram of ion activity product vs. precipitate for the water showed a rapid decrease in pH as Ca precipitated. Even a small decrease in CO32- level in the water would radically decrease the ion activity product due to the small amount present before the beginning of precipitation. This type of water might have a high tendency to create encrusting in the boiler. The degree of this tendency was measured by the index method of Puckorius, which was calculated from the following Eq. 3:
PSI = 2pHEq – pHS (3)
Where pHEq = 1.465 × log (Total alkalinity) + 4.54 and pHS = (9.3 + A + B) – (C + D) in which A = (log [TDS] − 1)/10; B = −13.12 × log(T) + 34.55; C = log [Ca2+] – 0.4; and D = log [Total alkalinity].
Here, pHs = pH at saturation in CaCO3, pHEq = Equilibrium pH, and T = Kelvin temperature of the water sample. In this Eq. Total alkalinity is equal to ([HCO3-] +2[CO32-] +[OH-]). The respective guideline values for PSI are given in Table 1.
| Index | Value | Remarks |
| Puckorius scaling index (PSI) | <4.5 | • water tends to encrust |
| 4.5 ≤ PSI ≤ 6.5 | • water is set within an optimum range where no corrosion may happen | |
| Langelier saturation index (LSI) | =0 | • water is thought to be neutral |
| <0 | • water tends to be corrosive | |
| >0 | • water is supersaturated regarding CaCO3 and encrust forming may happen | |
| Ryznar stability index (RSI) | 4.0 to 5.0 | • strongly encrusting |
| 5.0 to 6.0 | • slightly encrusting | |
| 6.0 to 7.0 | • slightly corrosive | |
| 7.0 to 7.5 | • pointedly corrosive | |
| 7.5 to 9.0 | • strongly corrosive | |
| 9 | • intolerably corrosive | |
| Chloride–sulfate mass ratio (CSMR) | <0.5 | • water has no potential for galvanic corrosion |
| >0.5 | • water with the potentiality of galvanic corrosion | |
| Revelle index (RI) | <0.5 | • equipment unaffected by salinization |
| 0.5–6.6 | • equipment slightly affected by salinization | |
| >6.6 | • equipment strongly affected by salinization | |
| Larson-Skold index (LI) | <<0.8 | • probably Cl– and SO42- will not inhibit natural film formation in water |
| 0.8<<LI<<1.2 | • Cl– and SO42- may prevent the film formation in water | |
| >>1.2 | • tendency to high corrosion rates should be expect- ed as the index increases | |
| Aggressive index (AI) | <0.8 | • water has a nonaggressive character |
| <10AI12 | • water sample is moderately aggressive | |
| <10 | • water presents a very aggressive nature | |
| Corrosivity index (CI) | >1 | • water has an unsuitable character |
| <1 | • water presents a suitable character |
Table1: Guideline values for industrial water quality indices
Langelier Saturation Index (LSI)
The LSI is a water quality factor that is used to determine the tendency to form CaCO3 scaling in water. This method estimates the degree of saturation and is measured by the calculation of the difference between the actual and theoretical pH of a water sample.
LSI = pHA – pHs (4)
Where, pHA is the actual pH of the water and pHs is the pH at saturation state in CaCO3 (theoretical value).
Ryznar Stability Index (RSI)
The RSI is a tool that is used to predict the probability of a CaCO3 scale forming in a given sample of water. Its attempts to provide the scientific community with a more accurate predictor of CaCO3 scaling. The Ryznar index was calculated as follows:
RSI = 2pHs – pHA (5)
Like LSI, pHA is the actual pH of the sample and pHs is the theoretical pH value.
Chloride–Sulfate Mass Ratio (CSMR)
The higher CSMR may increase the galvanic corrosion and related problems with lead solder water pipe joints. Values of CSMR exceeding about 0.6 were connected with accelerated lead solder corrosion (Edwards et al, 2007). The CSMR was calculated using the following Eq. (6) and the respective guideline values of this index are shown in Table 1.
CSMR = [Cl−] / [SO42−] (All ions were measured in mg/L) (6)
Revelle Index (RI)
Revelle (1941) projected the following method for calculating the RI, which was used to evaluate groundwater contamination from seawater intrusion: RI = [Cl−] / {[HCO3−] + [CO32-]} (7)
Where [Cl−] is the concentration of chloride; [HCO3−] is the concentration of bicarbonate; and [ CO32-] is the concentration of carbonate in the water sample.
Larson-Skold Index (LI)
The LI index was established for the measurement of corrosion rates of Great Lakes (USA-Canada) waters. This method extrapolates to another type of water, such as those of less alkalinity or high alkalinity, and goes outside the range of the original data. The index is recognized as a suitable tool for forecasting the aggressiveness of cooling waters in industry and was calculated using Eq.8:
LI = ([Cl–] + [SO42-]) / ([HCO3-] + [CO32-]) (All concentration is in mEq/L) (8)
Aggressive Index (AI)
The aggressive index is a part of standard C-400 recognized by the American Water Works Association (AWWA). It narrates the corrosivity of water and its effect on asbestos cement pipes. This index uses a formulation that is computed from the water pH, whether the water has more pH or less pH, the water hardness, how much Ca the water contains, and the value of the total alkalinity in the water.
AI = pHA + C + D (9)
Where, pHA = actual pH of the sample; C = log [Ca2+] - 0.4; and D = log [Total alkalinity]
Corrosivity Index (CI)
The corrosivity index is a degree of water quality that is used to determine whether the water will cause corrosion in the water supply pipes or will form a scale that can create blockages. It is measured using the following Eq. 10:
CI = (Cl-/35.5 + 2SO42-/96) / [(CO32- + HCO3-)/100] (10)
Results and Discussion
The descriptive statistical analyses of some selected physicochemical water parameters are displayed in Table 2. The analysis results illustrated that the pH was neutral to slightly basic, and higher levels of TDS, alkalinity, Ca2+, and HCO3-, and lower values of Cl-, SO42-, and CO32- were the main features of the groundwater chemistry in the study. These water parameters were used to calculate the industrial water quality indices and justify the cooling water suitability through a chemical approach. The study observed that the temporary water hardness and alkalinity have the potential for scale formation in the boilers and supply pipes (USGS 2018; Islam & Mostafa 2021d).
| Parameter | Pre-monsoon, PRM (n = 18) | Post-monsoon, POM (n = 18) | ||||||
| Mean | Min. | Max. | ± SD | Mean | Min. | Max. | ± SD | |
| Temperature | 32 | 27 | 36 | 1.88 | 29 | 24 | 33 | 2.12 |
| pH | 7.02 | 6.65 | 7.8 | 0.218 | 7.83 | 7 | 8.91 | 0.404 |
| TDS | 413.15 | 219 | 675 | 113.21 | 601.5 | 450.5 | 1109 | 156.2 |
| Total hardness (TH) | 362.8 | 121.5 | 564 | 93.66 | 404.8 | 225.7 | 613.3 | 93.8 |
| Total alkalinity (T. Alk.) | 418.6 | 271.5 | 703 | 110.81 | 451.56 | 251.62 | 819.65 | 124.27 |
| Ca2+ | 95.64 | 56.6 | 151.4 | 22.46 | 114.4 | 67.2 | 187.8 | 26.87 |
| Cl- | 31.19 | 12 | 562 | 9.292 | 27.09 | 12.9 | 41.8 | 7.6 |
| HCO3- | 418.6 | 271.5 | 703 | 110.81 | 448.78 | 248.5 | 817 | 124.45 |
| CO32- | 0 | 0 | 0 | 0 | 3.12 | 0 | 5.33 | 0.43 |
| SO42- | 16.46 | 2.91 | 45.7 | 9.292 | 15.14 | 2.95 | 41.7 | 9.25 |
| NO3- | 4.14 | 0.82 | 14.3 | 3.81 | 3.71 | 0.87 | 18.38 | 3.64 |
| Fe | 8.02 | 1.14 | 12.62 | 3.16 | 8.784 | 1.985 | 14.44 | 3.36 |
| Cu | 1.69 | 0.09 | 3.27 | 0.85 | 1.71 | 0.09 | 3.39 | 0.85 |
Note: the unit of all water parameters is mg/L, except temperature in OC and pH.
Table2: Descriptive statistics of physicochemical parameters in groundwater samples during the PRM and POM sampling rounds
Water Facies
The saturation index (SI) value (Eq. 2) of the major mineral solid phases including the calcite, aragonite, dolomite, anhydrite, gypsum, and halite in the analyzed groundwater samples were shown in Table 3.
The detailed dataset revealed that in about 90%, 20%, and 10% of the samples in the PRM sampling period, the index value for calcite (polymorph CaCO3), dolomite (CaMg (CO3)2), and aragonite (crystal CaCO3) was obtained more than 0 which indicates samples are oversaturated concerning these minerals and thus, they are precipitated (Srinivasamoorthy et al. 2013). Accordingly, the result designated that most of the samples are supersaturated regarding calcite mineral which leads to the elevated concentration of Ca2+ and HCO3- in groundwater of the three sampling rounds in the study area. The higher SI value for calcite focused on the likelihood of a further increase in Ca2+, Mg2+, and HCO3- concentration in the samples due to additional dissolution of this type of mineral. Besides, a higher level of aquifer CO2 pressure (Table 3) encourages carbonate mineral weathering (Romero-Mujalli et al. 2019). Thus, the groundwater facies of the study area are Ca-HCO3 (calcite type) classes and this factor mostly regulates the corrosivity and scale-forming tendency of the water for industrial uses.
Storability and Corrosivity Assessment – Chemical Approaches
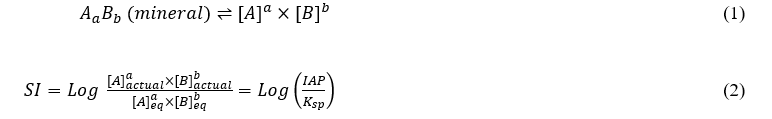
Most of the industrial plants in the Kushtia District are situated in the municipality area. Plastic and polymer, metal, food processing, plywood, oil, agro-based, pulp and paper, leather, sugar, etc. are the main types of industries in the area. The water supply from shallow aquifers is the major source of water for these industries to use in their boilers, coolers, and other production processing units. Water quality highly influences the finished product and the efficiency of machinery. For example, very hard water can cause scale and crusting formation in the boiler, resulting in the lifetime of the equipment being decreased (USGS 2018). The location of major industrial plants in Kushtia is presented in Fig. 2.
| Pre-monsoon (PRM), n=18 | |||||||
| Anhydride | Aragonite | Calcite | Dolomite | Gypsum | Halite | log10 pCO2 | |
| Minimum | -5.13 | -1.19 | -0.17 | -1.54 | -4.07 | -8.87 | -2.46 |
| Maximum | -2.04 | 0.83 | 2.1 | 0.78 | -1.9 | -5.45 | -0.88 |
| Mean | -2.94 | -0.36 | 0.98 | -0.26 | -2.44 | -7.05 | -1.45 |
| SD (±) | 0.55 | 0.2 | 0.17 | 0.41 | 0.47 | 0.42 | 0.26 |
| Post-monsoon (POM), n=18 | |||||||
| Minimum | -5.88 | -0.98 | -0.04 | -1.65 | -4.75 | -9.03 | -3.51 |
| Maximum | -2.45 | 0.82 | 2.76 | 0.67 | -1.86 | -6.1 | -1.26 |
| Mean | -2.8 | -0.29 | 1.12 | -0.3 | -3 | -7.56 | -2.27 |
| SD (±) | 0.63 | 0.21 | 0.22 | 0.53 | 0.5 | 0.51 | 0.45 |
Table3: Statistics of saturation index (SI) and log of pCO2 for different minerals/rocks in groundwater samples
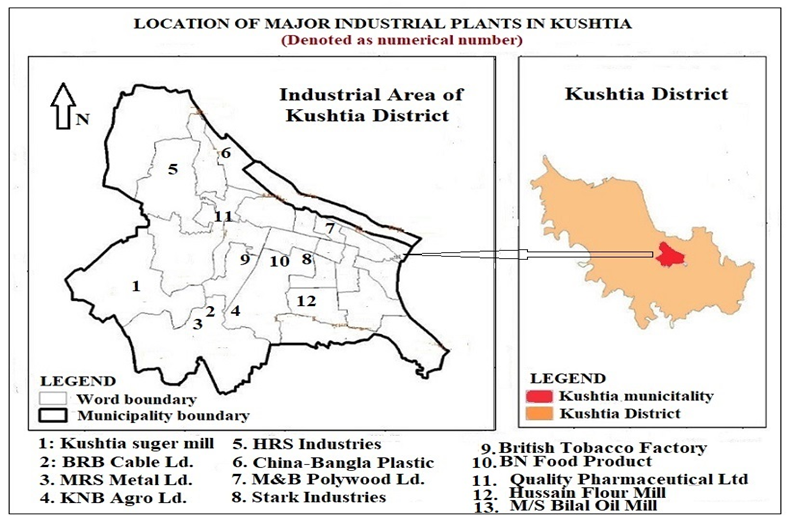
Figure2: Location of major industries in Kushtia (denoted by numerical number)
The water storage and distribution systems for domestic, agricultural, and industrial purposes are often marred by scaling and encrustation phenomena. These issues were influenced by variations in the physicochemical parameters of used water. These most common parameters include temperature, pH, EC, TDS, Ca2+, Mg2+, Fe, Cu, Cl-, HCO3-, CO32-, and SO42- (Helal et al. 2017; Magara 2014; Omeka et al. 2022). However, the combined effect of these water parameters on corrosion and scale formation can be more complex. The chemical features of the water flowing through a suppling pipe will affect whether the water is stable and will also influence the corrosive reactions. The main factors include pH, alkalinity, and water hardness, but oxidizing agents, saturated CO2, dissolved oxygen (DO), and TDS can also influence corrosion (Omeka et al. 2022). Usually, at low pH, acidic waters have lots of H+ ions to react with the electron at the cathode, so corrosion is boosted (Hem 1985). Water with a higher pH (alkaline) decreases the solubility of CaCO3 so that it is more likely to precipitate out as scale. On the other hand, hard water contains a higher amount of Ca-salts which can precipitate out as CaCO3 that forms scale. Though, if the hardness is noncarbonate, the Cl- and SO42- will tend to keep the Ca2+ in the solution and will prevent precipitation. Another water parameter, alkalinity, is the degree to which effortlessly the water pH can be changed, so it can be a mitigating effect concerning pH. High alkalinity in water is more likely to be scale-forming even at a comparatively low pH. Besides, waters with a low alkalinity deficiency have the buffering capacity to deal with acids, so these types of water can easily become acidic and corrosive. So, a high pH with low alkalinity in water led to corrosivity, and an inverse situation led to scale forming. The main features of groundwater chemistry in the study area were having higher TDS, alkalinity, TH, Ca2+, HCO3-, Cu, and Fe; and lower values of pH (mostly in PRM), SO42-, and Cl-. Very high carbonate hardness and bicarbonate alkalinity at relatively lower water pH in the samples create a complex situation regarding corrosion and water stability. Water with high alkalinity and hardness is more likely to be scale-forming even at a relatively low pH. On the other hand, in this situation, waters promote the buffering capacity, so they can easily become lower acidic and less corrosive. It was found that the average pH of samples in the study area is 7.4 in both sampling periods which is not enough lower or higher value to control the potentiality of corrosion and scale formation. So, higher alkalinity and hardness of calcite-type water are the major regulating factors to create corrosion and precipitation in industrial equipment. However, the standard chemical characteristic of water varies with the type of industry and finished products.
The quality requirements for industrial water supplies ranged widely (Hem 1985; Magara 2009), and almost every industrial application has set its standards (Table 4). The contaminated water used in industrial production would seriously impact the quality of products.
| Water parameter | Wood industry | Food industries | Pulp and paper | Synthetic polymer | Sugar mill | Canned and frozen fruits and vegetables |
| pH | 6.5-8.0 | 6.5-7.5 | 6.0-10.0 | 6.2-8.3 | 6.5-7.5 | 6.5-8.5 |
| TDS | 1000 | 500 | - | - | ˂500 | 500 |
| TH | 900 | 100 | 100 | 350 | 100 | 250 |
| Ca2+ | 100 | 20 | 20 | 80 | ˂50 | - |
| Mg2+ | 50 | 10 | 12 | 36 | - | - |
| HCO3- | 250 | 200 | - | - | 250 | - |
| NO3- | 5 | 5 | - | - | - | 10 |
| Cl- | 500 | 200 | 200 | - | 200 | 250 |
| SO42- | 100 | 50 | - | - | - | 250 |
Note: The unit of all water variables is mg/L, except pH.
Table4: Industrial water quality requirements, constructed by Hem (1985), Magara (2009), and Zeid et al. (2018)
After comparing the parameters of water samples with industrial standards given in Table 2, 100% of the studied samples are unsuitable for the wood, food, paper, and sugar industry (Fig. 3a,b,c,e). However, almost 89% of the studied samples are considered inappropriate for the polymer industry (Fig. 3d). In addition, the canned and frozen fruits diagram shows that nearly 84% of the water samples are nonpermissible (Fig. 3f). The absence values in Table 3 indicate either that no limit for the component or that the component can not attain offensive levels if the water meets the other conditions.
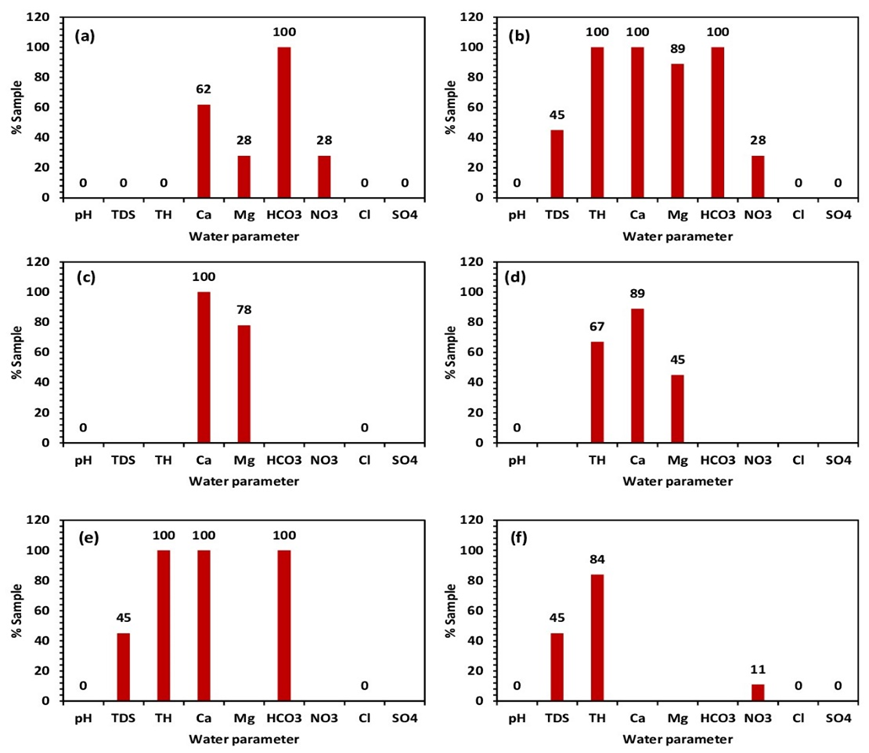
Figure3: Percentage of samples exceeded various water quality parameters(a) wood, (b) food, (c) paper, (d) polymer, (e) sugar, and (f) canned fruit industries
Water Quality Management in Cooling Systems
Cooling water includes a major part of the feeding of industrial water. The standards of cooling water quality are represented in Table 5. Circulated water is repetitively used in cooling operation systems. The quality of circulated water should be checked and controlled meanwhile it is in direct contact with cooling equipment and piping systems in the industry. The water is added to circulation arrangements to compensate for water loss due to evaporation, emission, or blowdown is called make-up water. The water quality standard and reference values for both types of water are quite different (Table 5). The concentration ratio (CR) is the fraction of the circulated water quality to that of make-up water as shown in the following Eq. 11 (JRA GL02-1994; ISO 16784-2006; Magara 2014). The standards in Table 4 take up a common CR of 2 to 5 in cooling systems.
Concentration Ratio (CR) = (Quality of circulated water)/(Quality of make-up water) (11)
In cooling systems, the metal parts may suffer from corrosion at a lower pH value, whereas the scale may form at a higher pH value (JIS K 0101 2012). Hence, the pH or acidity of cooling water should be controlled in the range of 6.5 to 8.0 (Magara 2014). Though the corrosion tendencies cannot be assessed by pH values alone, the other water parameters should also be considered. The pH value found in the groundwater samples ranges from 6.65 to 7.80 in the pre-monsoon (PRM) and 7.0 to 8.91 in the post-monsoon (POM) sampling periods, which falls within the standard value for both circulated and make-up water (Tables 2 and 5).
Electrical conductivity (EC) illustrates the total concentration of soluble salts in water (Islam & Mostafa 2022d). In industrial water, soluble salts are a factor of damage, such as scale formation and corrosion, as described above. The high EC in water is likely to cause such damage. The lower value of EC in make-up water increases the CR (Eq. 11) of the circulated cooling water and diminishes the loss of water because the quality of make-up water is contrariwise proportionate to the CR. The EC and pH values of water are easily counted and hence readily used in routine quality control. As with the pH value, the EC value of the samples is within the standard value of circulated and make-up water for the cooling system (Table 5).
The scale is formed on the heat exchange conductors in the cooling system, and therefore, causes impairment such as reduced heat conductivity. The mean concentration of Ca2+ and HCO3- as well as the value of total hardness (TH) in both the sampling rounds, are higher than the standard value of circulated and make-up water in the cooling system (Tables 2 and 5). So, there are great possibilities to form scale precipitation in cooling equipment in the industries of the study area. Also, it found that the measured concentration of iron (Fe) in all the samples is very higher than the reference value for both circulated and make-up water, resulting in the great prospect of corrosion in industrial equipment. The study showed that except for CO32-, the level of other items such as residual Cl-, Cu, and SO42- of groundwater samples crossed the reference value which encourages algal growth and water-borne diseases (Akoteyon et al. 2018). Chloride (Cl-) and sulfate (SO42-) ions are important factors for metal corrosion (Omeka et al. 2022). Water with a high level of SO42- (as H2SO4) is not appropriate for cooling water (Edwards et al. 2007). Normally, the concentration of SO42- is lower than that of Cl- in any water class. If the water contains a high level of SO42-, the water must be oxidized with aeration to strip SO2 gas into the air.
| Water parameter | Cooling water | Consideration | ||||
| Circulated water | Make-up water | CR | Corrosion | Scale formation | ||
| Standard | pH | 6.5 - 8.2 | 6.0 - 8.0 | - | ✓ | ✓ |
| EC | ≤ 8000 | ≤ 3000 | 2.67 | ✓ | ✓ | |
| TH | ≤ 200 | ≤ 70 | 2.86 | ✓ | ||
| T. alkalinity | ≤ 100 | ≤ 50 | 2 | ✓ | ||
| Cl- | ≤ 200 | ≤ 50 | 4 | ✓ | ||
| SO42- | ≤ 200 | ≤ 50 | 4 | ✓ | ||
| CO32- | ≤ 50 | ≤ 0 | 5 | ✓ | ||
| HCO3- | ≤ 250 | ≤ 100 | 2.5 | |||
| Reference | Fe | ≤ 1.0 | ≤ 0.3 | - | ✓ | |
| Cu | ≤ 0.3 | ≤ 0.1 | - | ✓ | ||
| SO42- | UDL | UDL | - | ✓ | ||
| Residual Cl- | ≤ 0.3 | ≤ 0.3 | - | ✓ | ||
Note: ‘Standard’ denotes critical parameters which directly influence the performance of facilities
‘References’ are suggested values to avoid nuisance by water-borne diseases or algal growing “√” marks in the Table show the factor relevant to corrosion or scale generation. UDL – Under detection limit
Table5: Cooling water standard for industrial purposes (Source: JRA GL02 1994; ISO 16784 2006; JIS K 0101 2012)
Evaluation of Industrial Water Quality - Using Index Methods
High-scale-forming and corrosive water can cause system failures in equipment or result in public health problems because of dissolved harmful components. The durability of industrial equipment and the quality of finished products depend on the quality of supplied water. Thus, corrosion and scaling are the major threats to a plant operation. Regular monitoring of water quality is a vital operational tool for the good governance of an industry. Several industrial water quality indexing methods were computed using the values of detected water parameters of different sampling seasons in the study area (Table 2), and several industrial water quality indexing methods (described in the methods section) were computed. Such indexing methods are Puckorius (PSI), Langelier (LSI), chloride–sulfate mass ratio (CSMR), Rayzner (RSI), Revelle (RI), Aggressive (AI), Larson–Skold (LI), and Corrosive index (CI). The results for both sampling periods with some statistical values of those calculations are included in Table 5 and Fig. 3. According to the results obtained, seasonal variation was observed. The pH, total alkalinity, Ca, and HCO3- loads of groundwater in the post-monsoon (POM) were obtained higher than in the pre-monsoon (PRM) season and that is the main cause of this variation (Table 2). The findings from the index calculation are discussed below:
Puckorius Scaling Index (PSI) and Chloride–Sulfate Mass Ratio (CSMR)
The precipitation features of water to achieve an equilibrium state and the buffering capacity of the aqueous medium can be effectively measured using PSI (Agatemor & Okolo 2008; Egbueri 2020b). This is attained by establishing the connotation between the acidity and alkalinity nature of water. Knowing the pH or alkalinity/acidity level of a certain water supply system helps in measuring and categorizing the corrosivity and scaling tendency of domestic and industrial water supply systems (Aghazadeh et al. 2017; Kumar 2019). PSI values ranged from 8.46-10.79 (PRM) and 8.48-10.86 (POM) with a mean value of 9.59 (PRM) and 9.57 (POM) (Table 5 and Fig. 4). Following the PSI classification criteria of US-EPA (1984), substantial corrosion tendencies (PSI>6.5) are observed in 100% of the water samples in both the sampling periods. This result suggests that the calcite groundwater samples in the study area have less encrusting than corrosive tendencies. This result is in agreement with that obtained for the Larson-Skold index (LI) and Langelier saturation index (LSI).
The concentration of Cl- and SO42- can have a direct bearing on the corrosivity of water; though, the higher level of Cl- in water is known to have a greater influence on its corrosive potentiality (Stets et al. 2017; Abbasnia et al. 2018; Egbueri 2020b). The elevated level of CSMR (>0.5) found for the studied groundwater samples (94.44%) suggest that the water samples have galvanic corrosion potential and can corrode leaded supply systems (Table 1). Though, only one (5.66%) out of the total samples (n=18) recorded CSMR values <0.5 and thus have no potential for galvanic corrosion in both sampling seasons (Tables 1 and 6).
| Index | Pre-monsoon (PRM) | Post-monsoon (POM) | ||||
| Range | Mean | Result (%sample) | Mean | Range | Result (%sample) | |
| Puckorius scaling index (PSI) | 8.46-10.79 | 9.59 | High corrosion (100%) | 8.48-10.86 | 9.57 | High corrosion (100%) |
| Dissolve scale | Dissolve scale | |||||
| -100% | -100% | |||||
| Chloride–sul- fate mass ratio (CSMR) | 0.36-4.08 | 1.88 | Galvanic corrosion (94.44%) | 0.44-3.17 | 1.61 | Galvanic corrosion (94.44%) |
| Langelier satura- tion index (LSI) | -1.65 | -0.197 | No scale (80%) | -1.68 | 0.59 | No scale (10%) |
| Encrusting (20%) | Encrusting (90%) | |||||
| Revelle index (RI) | 0.03-0.12 | 0.07 | Free from saliniza- tion (100%) | 0.03-0.10 | 0.06 | Free from saliniza- tion (100%) |
| Larson-Skold index (LI) | 0.090-0.265 | 0.158 | No corrosion (100%) | 0.070-0.251 | 0.131 | No corrosion (100%) |
| Ryznar stability index (RSI) | 6.06-8.21 | 7.408 | Slightly corrosive (15%) | 5.82-7.83 | 6.651 | Slightly encrusting (5%) |
| Strongly corrosive (85%) | Slightly corrosive (75%) | |||||
| Strongly corrosive | ||||||
| -20% | ||||||
| Aggressive index (AI) | 10.71-12.39 | 11.22 | Nonaggressive and scaling tendencies (16.67%) | 11.28-12.97 | 12.12 | Nonaggressive (67.5%) |
| Moderately aggres- | Moderately aggres- sive (32.5%) | |||||
| sive (83.33%) | ||||||
| Corrosivity index (CI) | 0.187-4.090 | 0.3 | Suitable (100%) | 0.123-3.651 | 0.252 | Suitable (100%) |
Table6: Statistical illustration of water quality indices for industrial purposes
Larson-Skold index (LI) and Langelier saturation index (LSI)
To find out the corrosivity nature of water, the relation between weak (CO32− and HCO3−) and strong (Cl− and SO42−) conjugated acidic anions is typically measured using the Larson-Skold index (LI). The higher concentration of SO42− and HCO3− is known to stimulate the scaling and corrosivity tendencies of water. It is due to the conversion of SO42− to S2- ions by sulfate-reducing bacteria present in water under anaerobic conditions (Agatemor & Okolo 2008; Egbueri 2020b; Ismail & El-Shamy 2009). The sulfate-reducing bacteria that exist in the dissolved organic matter act as electron donors and help convert the SO42- to S2-, thereby enhancing the encrustation (Sahinkaya et al. 2007). This process is shown in the following reaction (Eq. 12).
SO42- (soluble) + Organic matter → S2- (precipitate) + CO2 + H2O (12)
The acidic pH (˂7) of water may be impacted by the presence of bicarbonate (HCO3-), which reacts with metal sulfide (MS) minerals in the primary rock and can result in the formation of strong acid (H2SO4) thereby increasing the corrosive potentiality of the water (Mukate et al. 2019; Egbueri 2019a, b). In this study, HCO3- was observed to be the dominant anion among all water samples (Table 2).
An observation of Table 6 reveals that the Larson–Skold index (LI) results varied from 0.090-0.265 (PRM) and 0.070-0.251 (POM) averaging at 0.158 (PRM) and 0.131 (POM). Following the LI classification standards (US-EPA 1984; Abbasnia et al. 2018; Kumar 2019), no scaling and corrosion tendencies have been observed in all the samples at both sampling periods.
The Langelier saturation index (LSI) results varied from -0.68-0.97 (PRM) to -0.24-1.44 (POM) with a recorded mean value of -0.197 (PRM) and +0.590 (POM) (Table 6). An LSI value greater than 0 suggests that the water has a higher scaling possibility (supersaturated with CaCO3); an LSI value equal to 0 implies that there is no scaling potential in water (saturation is in an equilibrium state); nevertheless, an LSI value undersaturated with CaCO3 suggests that the water has a higher corroding potential, but lower scaling tendency (Table 1). Table 6 shows that in PRM season 20% of the samples have a serious encrusting problem. Whereas, due to a relatively higher concentration of HCO3- in water, 90% of the samples of the POM season have a great chance to form encrust on industrial equipment. The high scaling tendency detected could be attributed to the geological formation of the study area. As stated by Egbueri (2020b), water saturation to CaCO3 is mostly controlled by the number of carbonate rocks or minerals (e.g., dolomite and calcite) in the aquifer basement. This study confirmed that the groundwater facies of the study area is mainly Ca-HCO3 type and the dominant water-rock interaction is calcite dissolution. The high content of carbonate minerals reported (from the geological setting in the study area) within the primary mineral is in direct correlation with the high saturation of CaCO3 in the water (Egbueri et al. 2021, Islam & Mostafa 2022a). If carbonate minerals had been in low abundance in the fundamental geology, a lower level of Ca2+ and Mg2+ would have been expected (Egbueri 2020a, b). It can consequently be hypothesized that the comparatively high weathering rate of carbonate minerals in the study area enhanced the scaling tendency of water.
Ryznar Stability Index (RSI) and Revelle Index (RI)
The stability index was initially proposed by Ryznar (1944), for the evaluation of water stability. This index is found to be convenient as a projecting method for corrosivity and scale formation tendency in water delivery systems. Following the RSI cataloging standards (Kumar 2019), almost 100% of the samples are indicative of a slight to strong corrosive tendency (RSI ≥6), with a very low scaling tendency (Tables 1 and 6). This remark correlates effortlessly with the results obtained for the Langelier saturation index (LSI). Along with these findings, it can be assumed that the low scaling tendency detected among the water samples is accompanied by low contributions of Ca2+ and Mg2+ from the primary aquifer basements. Though, the high corrosivity tendency is attributed to the low pH (acidic) of the water (Agatemor & Okolo 2008). The Revelle index (RI) was utilized to regulate the influence of salinization on the equilibrium chemistry, corrosion, and scaling level of given water (Akoteyon et al. 2018). Because of the low Cl- and elevated HCO3- levels, approximately 100% of the total water samples seem to be unaffected by salinization (RI˂0.5) (Table 5). It can be assumed from this result that the source of salinity-forming salts (mainly Na+ and Cl−) was not halite-salts dissolution or seawater intrusion (Mukate et al. 2019; Egbueri 2019a, b; Rigobert & Fru 2020). These may be coming from any mixed rocks in the groundwater systems (Islam & Mostafa 2022a).
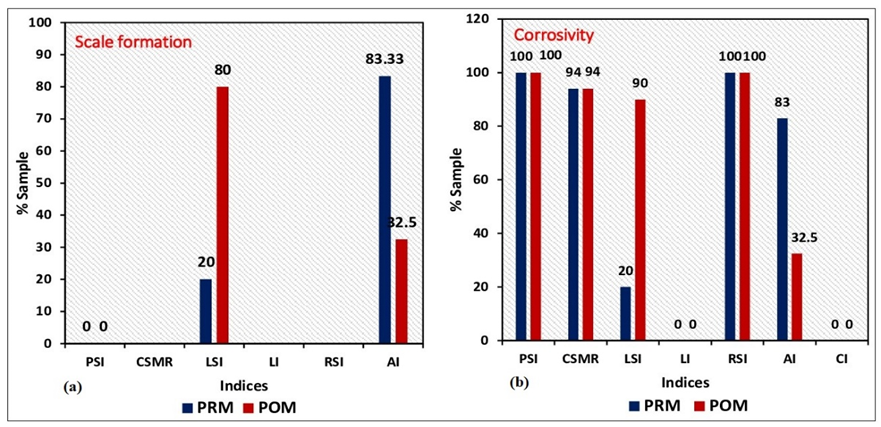
Figure4: Percentage of the samples crossed the (a) scale formation and (b) corrosive tendency in the pre-monsoon (PRM) and post-monsoon (POM) sampling seasons
Aggressive Index (AI)
The Aggressive index was initially established to monitor water in the asbestos pipe. It is occasionally substituted for the Langelier saturation index (LSI) as an indicator of the corrosive potentiality of the water (Philibert et al. 2017). The AI varied from 10.71to 12.39 with an average of 11.22 in the PRM period and varied from 11.28 to 12.97 with an average of 12.12 in the PRM period (Table 6 and Fig. 3). The AI analysis results illustrated that about 16.67% of the samples had to scale tendencies, but they were non-aggressive. About 83.33% of the samples were of a moderately aggressive/corrosive nature in the PRM season (USEPA 1984; Abbasnia et al. 2018; Kumar 2019), whereas samples were of a relatively less aggressive nature in the POM season. The AI is dependent on the total hardness (TH), pH, and total alkalinity (HCO3-). The experiential results are consistent with other corrosivity and scaling index results from this investigation.
Corrosivity Index (CI)
The CI varied from 0.187 to 4.090 with an average of 0.30 in the PRM period, and 0.123 to 3.651 with an average of 0.52 in the PRM period (Table 6). According to the CI analysis results, 100% of the samples were within the safe ranges, i.e., no corrosion occurred. If CI >1, the water was an unsuitable character, and when it was <1 xss=removed>Singley 1981). Due to the very high concentration of HCO3- compared to Cl- and SO42- in the samples, it is expected that the CI value would be very low.
Conclusion
The study attempted to evaluate the suitability of calcite-type groundwater in the middle-west part of Bangladesh for industrial uses. Samples were collected from the shallow aquifer twice a year, viz., the pre-monsoon (PRM) and post-monsoon seasons. The analytical results showed that the almost neutral pH; the higher value of TDS, total hardness, Ca2+, Fe, Cu, and HCO3-, and the lower concentration of Cl-, SO42-, NO3-, and CO32- are the main water chemistry in the study area. Cooling water comprises the majority of the consumption of industrial water. The study illustrated that the circulated and make-up cooling water was less corrosive but had a higher tendency to scale formation. In addition, about 100% of the samples are less suitable for the wood, food, paper, and sugar industries, and about 85% of the samples are not appropriate for the canned and polymer plastic industry. Various indexing models were calculated and the results were included methodically for the industrial water quality assessment. The results showed that water sources were found non-corrosive concerning the Larson-Skold index (LI) and Corrosivity index (CI). However, low and strong corrosion and aggressive nature were observed by the Ryznar stability index (RSI) and Aggressive index (AI) of the water for both seasons. Furthermore, according to the Puckorius scaling index (PSI), all samples have no scale-forming nature, but 100% of the samples have high corrosivity. For the Langelier saturation index (LSI), 90% of the samples in the post-monsoon period have an encrusting trend and have a low tendency to scale formation. Generally, the LSI, RSI, and AI values depend on the actual pH of water samples. The actual pH value (pHA) of water samples in the POM (≈8) is greater than in the PRM (≈7) period, and for this reason, the mean values of the LI and AI obtained were higher and the RSI obtained were lower in the POM than in the PRM seasons. The high CSMR values recorded for the analyzed groundwater samples (94.44%) suggest that the water has galvanic corrosion potential. Besides, RI values showed that the samples were free from sodicity and that no seawater intrusion occurred in the study area. The results of the incorporation of multiple storabilities and corrosivity assessment indices showed that the groundwater samples have low corrosion and high scaling tendency, resulting in a high risk of corrosion and encrustation to domestic, industrial, municipal, and agricultural water supply and storage facilities. However, there is a higher risk of scale formation in boiling pools at high temperatures due to the higher concentrations of HCO3- and Ca2+ in the groundwater of the study area. Hence, the water should be used in industrial plants after the necessary treatment.
Declaration
Funding Statement
The study has not received any funds from any organization or institute.
Conflict of Interest
The authors declare no conflict of interest.
References
- Abbasnia, Abbas, Mahmood Alimohammadi, Amir Hossein Mahvi, Ramin Nabizadeh, Mahmood Yousefi, Ali Akbar Mo- hammadi, Hassan Pasalari, and Majid Mirzabeigi. “Assess- ment of groundwater quality and evaluation of scaling and cor- rosiveness potential of drinking water samples in villages of Chabahr city, Sistan and Baluchistan province in Iran.” Data in brief 16 (2018): 182-192.
- Abrahão, Raphael, Monica Carvalho, W. R. Da Silva Jr, T. Machado, C. Gadelha, and M. Hernandez. “Use of index analy- sis to evaluate the water quality of a stream receiving industrial effluents.” Water Sa 33, no. 4 (2007).
- Agatemor, Christian, and Patrick O. Okolo. “Studies of corro- sion tendency of drinking water in the distribution system at the University of Benin.” The Environmentalist 28 (2008): 379-384.
- Aghazadeh, N., M. Chitsazan, and Y. Golestan. “Hydrochemis- try and quality assessment of groundwater in the Ardabil area, Iran.” Applied Water Science 7 (2017): 3599-3616.
- Akoteyon, Isaiah Sewanu, Isaac Idowu Balogun, and Alabi S. Okanlawon Soneye. “Integrated approaches to groundwater quality assessment and hydrochemical processes in Lagos, Nigeria.” Applied Water Science 8 (2018): 1-19.
- Appelo, C.A.J. and Postma, D., 2004. Geochemistry, ground- water and pollution. CRC press.
- Asghari, Farzaneh Baghal, Jalil Jaafari, Mahmood Yousefi, Ali Akbar Mohammadi, and Reza Dehghanzadeh. “Evaluation of water corrosion, scaling extent and heterotrophic plate count bacteria in asbestos and polyethylene pipes in drinking water distribution system.” Human and ecological risk assessment: an international journal 24, no. 4 (2018): 1138-1149.
- Edwards, Marc, and Simoni Triantafyllidou. “Chloride-to-sulfate mass ratio and lead leaching to water.” Journal American Wa- ter Works Association 99, no. 7 (2007): 96-109.
- Egbueri, Johnbosco C. “Water quality appraisal of selected farm provinces using integrated hydrogeochemical, multivari- ate statistical, and microbiological technique.” Modeling Earth Systems and Environment 5, no. 3 (2019): 997-1013.
- Egbueri, Johnbosco C. “Evaluation and characterization of the groundwater quality and hydrogeochemistry of Ogbaru farming district in southeastern Nigeria.” SN Applied Sciences 1, no. 8 (2019): 851.
- Egbueri, Johnbosco C. “Heavy metals pollution source iden- tification and probabilistic health risk assessment of shallow groundwater in Onitsha, Nigeria.” Analytical letters 53, no. 10 (2020): 1620-1638.
- Egbueri, Johnbosco C. “Groundwater quality assessment us- ing pollution index of groundwater (PIG), ecological risk index (ERI) and hierarchical cluster analysis (HCA): a case study.” Groundwater for sustainable development 10 (2020): 100292.
- Egbueri JC, Unigwe CO, Omeka ME, Ayejoto DA (2021) Urban groundwater quality assessment using pollution indicators and multivariate statistical tools: a case study in southeast Nigeria. Int J Environ Anal Chem. 1-27.
- Egbueri, Johnbosco C., Daniel A. Ayejoto, and Johnson C. Ag- basi. “Pollution assessment and estimation of the percentages of toxic elements to be removed to make polluted drinking wa- ter safe: a case from Nigeria.” Toxin reviews 42, no. 1 (2023): 146-160.
- Egbueri, Johnbosco C. “Predicting and analysing the quality of water resources for industrial purposes using integrated da- ta-intelligent algorithms.” Groundwater for Sustainable Devel- opment 18 (2022): 100794.
- García-Ávila, Fernando, Lía Ramos-Fernández, and César Zhindón-Arévalo. “Estimation of corrosive and scaling trend in drinking water systems in the city of Azogues, Ecuador.” Revis- ta Ambiente & Água 13 (2018): e2237.
- Godelitsas A, Astilleros JM (2010) Dissolution, sorption/(re) precipitation, formation of solid solutions and crystal growth phenomena on mineral surfaces: implications for the removal of toxic metals from the environment. EMU Notes in Mineralo- gy Vol. 10, Chapter 8, pp. 289–324.
- Helal Uddin, S. M., M. G. Mostafa, and A. B. M. H. Haque. “Evaluation of groundwater quality and its suitability for drink- ing purpose in Rajshahi City, Bangladesh.” Water Science and Technology: Water Supply 11, no. 5 (2011): 545-559.
- Hem JD (1985) Study and Interpretation of the Chemical Char- acteristics of Natural Water. 3rd Edition, U.S. Geological Sur- vey 604 South Pickett St. Alexandria, VA 22304.
- Islam, Md Shajedul, and S. M. M. H. Majumder. “Alkalinity and hardness of natural waters in Chittagong City of Bangladesh.” International Journal of Science and Business 4, no. 1 (2020): 137-150.
- Islam, Md Shajedul, and M. G. Mostafa. “Groundwater status and challenges in Bangladesh.” Sustainable Agriculture Re- views 52 (2021): 79-146.
- Islam MS, Mostafa MG (2021b) Groundwater Quality and Risk Assessment of Heavy Metal Pollution in Middle-West Part of Bangladesh. J Earth & Environ Sci Res. 3(2):1-15.
- Islam, Md Shajedul, and M. G. Mostafa. “Development of an integrated irrigation water quality index (IIWQIndex) model.” Water Supply 22, no. 2 (2022): 2322-2337.
- Islam MS, Mostafa MG (2021d) Groundwater suitability for ir- rigated agriculture in Alluvial Bengal delta plain: A review. Int J Adv App Sci. 10(2):156-170.
- Islam, Md Shajedul, and M. G. Mostafa. “Evaluation of hydro- geochemical processes in groundwater using geochemical and geostatistical approaches in the Upper Bengal Basin.” Geofluids 2022, no. 1 (2022): 9591717.
- Islam, M. S., and M. G. Mostafa. “Selection of water quality index models for the evaluation of groundwater quality: A case study in river basin, Kushtia, Bangladesh.” H2 Open. 2022e 5, no. 2 (2022): 198-220.
- Islam, M. S., and M. G. Mostafa. “Health risk assessment of trace metals from groundwater in the deltaic plain of Bangla- desh.” International Journal of Water Resources & Environ- mental Sciences 10, no. 1 (2022): 1-13.
- Islam MS, Mostafa MG[2022] (2022d) Assessing groundwater suitability for irrigation: comparison between newly developed indexing method and classical techniques. J Sust Agri & En- viron.:1-14.
- Ismail, A. I. M., and A. M. El-Shamy. “Engineering behaviour of soil materials on the corrosion of mild steel.” Applied clay science 42, no. 3-4 (2009): 356-362.
- ISO 16784-1 (2006) Corrosion of metals and alloys - Corrosion and fouling in industrial cooling water systems – Part Guide- lines for conducting pilot-scale evaluation of corrosion and fouling control additives for open recirculating cooling water systems. 1st edn. pp 1-14.
- JIS K 0101 (2012) Testing methods for industrial water. Japa- nese testing association, 98th Edition, pp 488.
- JRA-GL-02 (1994) Japan Refrigeration and Air Conditioning Industry Association Standard.
- Khorsandi H, Mohammad A, Karimzadeh S, Khorsandi J (2015) Evaluation of corrosion and scaling potential in rural wa- ter distribution network of Urmia, Iran. Desalination and Water Treatment 11(40):18.
- Kumar PJ (2019) Assessment of corrosion and scaling poten- tial of the groundwater in the Thanjavur district using hydrogeo- chemical analysis and spatial modeling techniques. SN Appl Sci. 1(5):395.
- Magara Y (2014) Industrial Water. E-book: Water quality stan- dared, vol. 1, pp. 23.
- Mirzabeygi, Majid, Mozhgan Naji, Nader Yousefi, Mahmoud Shams, Hamed Biglari, and Amir Hossein Mahvi. “Evaluation of corrosion and scaling tendency indices in water distribution system: a case study of Torbat Heydariye, Iran.” Desalination and Water Treatment 57, no. 54 (2016): 25918-25926.
- Mukate SV, Panaskar DB, Wagh VM, Baker SJ (2019) Under- standing the influence of industrial and agricultural land uses on groundwater quality in semiarid region of Solapur. India: En- viron Dev Sust.
- Omeka, Michael E., Johnbosco C. Egbueri, and Chinanu O. Unigwe. “Investigating the hydrogeochemistry, corrosivity and scaling tendencies of groundwater in an agrarian area (Nige- ria) using graphical, indexical and statistical modelling.” Arabi- an Journal of Geosciences 15, no. 13 (2022): 1233.
- Parkhurst, David L., and C. A. J. Appelo. “Description of input and examples for PHREEQC version 3—a computer program for speciation, batch-reaction, one-dimensional transport, and inverse geochemical calculations.” US geological survey tech- niques and methods 6, no. A43 (2013): 497.
- Philibert, Marc, Sofia Mendaza, Flavia Zraick, and Benjamin Rabaud. “Predicting the effect of water quality on water distri- bution cast iron and steel pipes using two novel indices.” Water Science and Technology: Water Supply 18, no. 2 (2018): 524- 538.
- Revelle, Roger. “Criteria for recognition of the sea water in ground-waters.” Eos, Transactions American Geophysical Union 22, no. 3 (1941): 593-597.
- Rigobert, M. O. T. C. H. E. M. I. E. N., and FONTEH Mathias FRU. “The impact of sea water intrusion on the spatial variabil- ity of the physical and chemical properties of ground water in Limbe-Cameroon.” African Journal of Environmental Science and Technology 14, no. 4 (2020): 92-103.
- Romero-Mujalli, Gibran, Jens Hartmann, and Janine Börk- er. “Temperature and CO2 dependency of global carbonate weathering fluxes–Implications for future carbonate weather- ing research.” Chemical Geology 527 (2019): 118874.
- Ryznar, John W. “A new index for determining amount of cal- cium carbonate scale formed by a water.” Journal American Water Works Association 36, no. 4 (1944): 472-483.
- Sahinkaya, Erkan, Bestamin Özkaya, Anna H. Kaksonen, and Jaakko A. Puhakka. “Sulfidogenic fluidized-bed treatment of metal-containing wastewater at 8 and 65C temperatures is lim- ited by acetate oxidation.” Water Research 41, no. 12 (2007): 2706-2714.
- Singley JE, Rodolfo Jr, Ahmadi A, Pisigan PO, Lee T (1985) Corrosion and calcium carbonate saturation index in water distribution systems. U.S. Environmental Protection Agency, Washington D.C., EPA/600/2-85/079.
- Soroush F, Mousavi S-F, Gharechahi A (2011) A fuzzy industrial water quality index: Case study of Zayandehrud River system. Iranian J Sci & Techno Transaction B: Engineering 35(C1):131- 136. 48.
- Srinivasamoorthy, K., M. Vasanthavigar, K. Vijayaraghavan, R. Sarathidasan, and S. Gopinath. “Hydrochemistry of groundwa- ter in a coastal region of Cuddalore district, Tamilnadu, India: implication for quality assessment.” Arabian Journal of Geosci- ences 6 (2013): 441-454.
- Stets, Edward G., Casey J. Lee, Darren A. Lytle, and Michael R. Schock. “Increasing chloride in rivers of the conterminous US and linkages to potential corrosivity and lead action level exceedances in drinking water.” Science of the Total Environ- ment 613 (2018): 1498-1509.
- Tchounwou, Paul B., Clement G. Yedjou, Anita K. Patlolla, and Dwayne J. Sutton. “Heavy metal toxicity and the environment.” Molecular, clinical and environmental toxicology: volume 3: en- vironmental toxicology (2012): 133-164.
- US-APHA (2005) Standard methods for the examination of the water and wastewater, 21st edn. APHA (AmericanPublic Health Association), AWWA, WPCF, Washington, DC, pp. 1134.
- US-EPA (1984) Corrosion manual for internal corrosion of wa- ter distribution systems. U.S. Environmental Protection Agen- cy, Washington, DC.
- USGS (2018) Hardness of water. Water science school, U.S. Geological Survey, US department of interior.
- Zeid SAM, Seleem EM, Salman SA, Abdel-Hafiz MA (2018) Water quality index of shallow groundwater andassessment for different usages in El-Obour city, Egypt. J Mater Environ Sci. 9(7):1957-1968.


