Archive : Article / Volume 3, Issue 1
- Research Article | DOI:
- https://doi.org/10.58489/2836-5917/016
Association of Body Fat Percentage with History Pathological in Older Adults
1Central University of Venezuela | UCV · Escuela de Nutrición y Dietética
Gerardo Jose Bauce, Central University of Venezuela | UCV . Escuela de Nutricion y Dietetica.
Gerardo Jose Bauce, Association of Body Fat Percentage with History Pathological in Older Adults. Clin. Cardiol. Res. Vol. 3 Iss. 1. (2024) DOI: 10.58489/2836-5917/016
© 2024 Gerardo Jose Bauce, this is an open-access article distributed under the Creative Commons Attribution License, which permits unrestricted use, distribution, and reproduction in any medium, provided the original work is properly cited.
- Received Date: 07-07-2023
- Accepted Date: 14-08-2023
- Published Date: 12-03-2024
Risk. Overweight. Obesity. Logistic Regression. Sensitivity. Specificity
Abstract
Objective: to apply a regression equation to estimate the percentage of body fat in older adults. Method: Descriptive, prospective, cross-sectional and correlational study. Sample of 553 older adults, 28.0% of men and 72.0% of women; variables: sex, age, weight, height, WC, BMI, BFPD and BFPR. Results: mean age and similar BMI by sex; weight, height, higher WC in men and higher BFPD and BF´PR in women; weight, height, and BMI decrease with age. Percentage of similar overweight by sex, according to BMI and only in women according to BFPR, the latter associated with hypertension, diabetes mellitus, osteoporosis and neuropsychiatric diseases. The values estimated by the BFPR equation are normally distributed, and the Logistic Regression reveals that the model based on the variables BMI, WC and sex, is reliable, with high sensitivity and specificity, which demonstrates high discriminative power. Conclusion: the equation to estimate the percentage of body fat by regression may be useful to estimate risk in older adults.
Introduction
According to information published by the World Health Organization (WHO), the figures for overweight and obesity in older adults indicate that between 2015 and 2050 the population over 60 years of age will double in percentage terms, going from 12% to 22%m people in this age group will live in low- and middle-income countries [1]. It further adds that today people have a life expectancy of 60 years or more, and that all countries experience an increase in both the number and proportion of older people in the population [1].
On the other hand, PAHO believes that healthy and independent older people can contribute to the well- being of the family, as well as the community; however, the number of older persons is currently increasing exponentially in complex and uncertain socioeconomic situations, so that timely intervention is necessary to enhance the contribution of this group to social development and prevent it from becoming a factor of crisis or nuisance for social security in the Americas [2].
In Venezuela, data published by Provea, indicate that the population of 60 years or more for the year 2010 was 2,519,751, and it is estimated that by 2030 it will increase by 120.62% to place the figure at 5,558,973. It also adds that in relation to the pension have been excluded from social security 1,400,000 older adults, in 2015 [3].
However, it is important that older adults are evaluated to verify their health status, considering that in this age group is when more health problems occur, and it is common for many to have more than one pathology. One of the many causes of disease is related to nutritional status, and to overweight and obesity, which is why it has been considered to conduct a study in which the elderly are evaluated in relation to overweight and obesity. One measure to perform such an evaluation is to estimate the percentage of body fat.
The percentage of body fat (BFP) is an indicator that has been questioned, as Its calculation formula is considered poorly adjusted to reality or unreliable, and different options have been proposed that often turn out to be invasive. One of them is the bioimpedance of a commercially available frequency (TBF-%%), Tanita Corp, Tokyo, Japan) [4]; another is image processing (computed tomography) [5]; nuclear magnetic resonance [6]; dual-energy X-ray bone absorptiometry (DEXA) [7]; in addition, densitometry, performed either by plethysmography (Bod Pod) or underwater weight [8]; and bioimpedance (BIA) [9], among others. However, most of these procedures are invasive and in addition to being expensive, they involve having a very well-trained staff and having adequate and/or conditioned environmental conditions to be able to perform this measurement in optimal conditions.
WHO figures indicate that since 1975, obesity has practically tripled worldwide; and by 2016 more than 1900 million adults, over 18 years of age, were overweight, and of these, more than 650 million, equivalent to 34.21%, were obese people; In addition, most of the world’s population (65%) lives in countries where obesity and overweight are causes of death, much more than underweight due to malnutrition [10].
Several epidemiological studies indicate the benefits of a low or acceptable percentage of body fat, as well as the health risks due to chronic or acute disease (coronary heart disease, hypertension, diabetes mellitus) due to high levels of it evidenced in overweight or obesity [11-14].
In Venezuela, according to the publication of the National Institute of Nutrition (INN) [15], the results reveal a prevalence of overweight of 29.52%, and obesity of 25.43%, in adults aged 18 to 40 years. and highlights that the level of sedentary or insufficiently active increases with advancing age, and progressively decreases the number of subjects considered sufficiently active [15].
Methods
This is a descriptive, prospective, cross-sectional and correlational study, based on a sample of 553 older adults, selected from previous studies, who participated voluntarily, after information on the use of the data provided and given their informed consent, as required by the World Medical Association Declaration of Helsinki (WMDH) Ethical Principles for Medical Research and Involving Human Subjects (2013) [16].
The variables sex, age, weight, height, BMI, WC, and PGC were considered, in order to compare the results by age groups and sex, as well as the criteria to classify these adults, according to the equations selected for the calculation of the Body Fat Percentage (PGC), and suggest the use of the one that is most appropriate for this purpose.
It is considered to take into account that for the validity of the study, it must be free of errors, which may be due to the subjects, the instruments for the measurement and those who evaluate, since they must evaluate these measurements from the statistical point of view [17]. For Body Fat Percentage, the Deurenberg formula was used as a model to compare [18]:
BFP (%) = (1.20 x BMI) + (0.23 x Age) – (10.8 x Gender*) – 5.4.
Where gender equals: Male = 1 and Female = 0 And the formula obtained by regression, which includes the variables BMI, WC and sex, obtained by Bauce et al [19], as the main model, since it has been evaluated. This equation is BFPR=0.0431*CC+1.0409*BMI- 11.1795*Sex+11.4878
It has a coefficient of determination equal to 0.9481, a multiple correlation coefficient equal to 0.9737 and an error of estimation of 1.76.
For the purposes of analysis, adults were classified according to the Deurenberg formula and this equation identified as PGCR, and the percentages in each of the categories were compared with the percentages obtained in the BMI classification.
The Following Criteria or Reference Values were Considered
For Body Mass Index (BMI), it was calculated using the Quetelet [20]. Thinness is established as a BMI < 23.0; normal, 23.0-27.9; overweight, > 28.0 to
31.9; and obesity, ≥ 32.0 [21].
For Waist Circumference (WC), the following values were considered: for men: Normal (WC < 95 cm); High risk (95 cm≤ CC<102 cm) and very high risk (CC ≥ 102 cm); for women: Normal (CC < 82 cm); High risk (between 82 cm ≤ CC < 88 cm) and High risk (CC ≥ 88 cm) [22].
For Body Fat Percentage (BCP) the criterion used corresponds to that suggested by the National Institute of Nutrition (INN) [23] based on percentiles: Category I: PGC < P5 (Deficiency Fat); Category II: P5≤PGC Descriptive measures such as mean, deviation, percentage were determined; association measures such as correlation and regression coefficient, Chi- square independence test; hypothesis testing for the difference in means, for the difference in percentages; Logistic regression to determine sensitivity and specificity.
Results
The sample of 553 adults is made up of 28.0% men and 72.0% women; with the following averages in the variables considered: Age 71.9±7.9 years; Weight 66.7±13.3 kg; Size 157.6±9.1 cm; WC 93.9±11.9 cm; BMI 26.7±4.6 kg/m2; BFPD 40.2±7.6 and BFPR 40.2±7.4.
When comparing these averages by sex, age and BMI are similar; weight, height and WC are higher in males, and BFPD and BFPR are higher in females. Comparison using the mean difference test indicates that mean age and BMI are not significant; and the means of weight, height, WC, BFPD and BFPR are statistically significant (p<0.000) (Table 1).
For the group of 60 to 69 years, made up of 242 older adults, the averages are age 64.7±2.9 years; weight 69.6±13.4 kg; height 159.2±9.3 cm; WC 93.3±12.2 cm; BMI 27.4±4.6 kg/m2; BFPD 39.4±7.3 and BFPR 41.0±7.0; the average weight, height and WC are higher in males, and those of BFPD and BFPR are higher in females; and the mean comparison test
shows that age and BMI are not significant, and the means of weight, height, WC, BFPD and BFPR are statistically significant (Table 1).
For the group of 70 to 79 years, made up of 207 older adults, the averages are age 70.4±2.8 years; weight 66.8±13.3 kg; height 157.2±9.5 cm; CC 94.6±12.2 cm; BMI 26.9±4.5 kg/m2; PGCD 40.7±7.7 and PGCR 40.3±7.5; the averages of weight, height and WC are higher in the male sex, and those of BMI, PGCD and PGCR are higher in the female sex; and the mean comparison test shows that age and BMI are not significant, and the means of weight, height, WC, PGCD and PGCR are statistically significant (Table 1).
For the group ≥ 80 years, made up of 107 older adults, the averages are age 84.3±3.5 years; weight 59.5±10.4 kg; height 154.3±6.7 cm; CC 91.5±11.6 cm; BMI 25.0±4.1 kg/m2; PGCD 41.2±7.0 and PGCR 38.6±7.1; the averages of weight, height and WC are higher in the male sex, and those of BMI, PGCD and PGCR are higher in the female sex; and the mean comparison test shows that age, WC, and BMI are not significant, and the means of weight, height, PGCD, and PGCR are statistically significant (Table 1).
|
Variables and indicators
|
|||||||
|
|
Age
|
Weight
|
Size
|
C C(cm)
|
BMI(Kg/m2)
|
PGCD
|
PGCR4
|
|
Sample (n=553)
|
71.9 ± 7.9
|
66.7 ± 13.3
|
157.6 ± 9.1
|
93.3 ± 11.9
|
26.7 ± 4.6
|
40.2 ± 7.6
|
40.2 ± 7.4
|
|
Male (n=155)
|
71.6 ± 8.0
|
74.2 ± 14.3
|
167.3 ± 7.9
|
96.5 ± 11.6
|
26.4 ± 4.2
|
31.9 ± 4.8
|
31.9 ± 4.8
|
|
Female (n=398)
|
71.9 ± 7.8
|
63.8 ± 11.7
|
153.8 ± 6.4
|
92.2 ± 11.8
|
26.9 ± 4.6
|
43.5 ± 5.6
|
43.5 ± 5.3
|
|
P value
|
0,690
|
0,000
|
0,000
|
0,000
|
0,222
|
0,000
|
0,000
|
|
60 to 69 years
|
|||||||
|
Sample (n=242)
|
64.7 ± 2.9
|
69.6 ± 13.4
|
159.2 ± 9.3
|
93.3 ± 12.2
|
27.4 ± 4.6
|
39.4 ± 7.3
|
41.0 ± 7.0
|
|
Male (n=67)
|
64.6 ± 2.9
|
79.2 ± 13.0
|
170.1 ± 6.4
|
99.1 ± 11.6
|
27.4 ± 4.5
|
31.5 ± 4.8
|
33.0 ± 4.6
|
|
Female (n=175)
|
64.8 ± 2.9
|
66.0 ± 11.7
|
155.0 ± 6.5
|
91.0 ± 11.5
|
27.5 ± 4.7
|
42.5 ± 5.7
|
44.0 ± 5.3
|
|
P value
|
0,632
|
0,000
|
0,000
|
0,000
|
0,884
|
0,000
|
0,000
|
|
70 to 79 years
|
|||||||
|
Sample (n=207)
|
74.0 ± 2.8
|
66.8 ± 13.3
|
57.4 ± 9.5
|
94.6 ± 12.2
|
26.9 ± 4.5
|
40.7 ± 7.7
|
40.3 ± 7.5
|
|
Male (n=61)
|
73.5 ± 3.1
|
73.5 ± 10.0
|
167.0 ± 8.5
|
95.9 ± 11.2
|
26.2 ± 3.8
|
32.2 ± 4.5
|
31.8 ± 4.4
|
|
Female (n=146)
|
74.2 ± 2.7
|
64.0 ± 11.9
|
153.5 ± 6.6
|
94.1 ± 12.6
|
27.2 ± 4.8
|
44.3 ± 5.8
|
43.8 ± 5.4
|
|
P value
|
0,218
|
0,000
|
0,000
|
0,312
|
0,114
|
0,000
|
0,000
|
|
≥ 80 years
|
|||||||
|
Sample (n=104)
|
84.4 ± 3.5
|
59.5 ± 10.4
|
154.3 ± 6.7
|
91.5 ± 11.6
|
25.0 ± 4.1
|
41.2 ± 7.0
|
38.6 ± 7.1
|
|
Male (n=27)
|
84.9 ± 3.9
|
63.3 ± 12.2
|
161.2 ± 6.0
|
90.2 ± 10.3
|
24.4 ± 4.8
|
32.6 ± 5.5
|
29.6 ± 5.4
|
|
Female (n=77)
|
84.2 ± 3.4
|
58.2 ± 9.4
|
151.9 ± 5.1
|
91.5 ± 10.6
|
25.2± 3.9
|
44.2 ± 4.6
|
41.7 ± 4.4
|
|
P value
|
0,412
|
0,056
|
0,000
|
0,578
|
0,440
|
0,000
|
0,000
|
Table 1. Descriptive measures of the variables included in the study. Seniors
The classification of BMI, and of the criteria used to classify the Body Fat Percentage reflects similarpercentages in the two sexes in the normal category, for BMI; however, the percentages are very different in the two sexes, for the BFPR, according to the M±SD criterion, since it is much higher in the female sex, and according to the percentile criterion it does not place any percentage in the male sex and 14.1% in the female sex. With regard to the categories overweight and obesity, the BMI is 18.1% and 23.6% in obesity for men and women; and places similar percentages in overweight; on the other hand, the BFPR places percentages only for the female sex, according to the two criteria, in overweight, and only 2.5% in overweight, according to the M±SD criterion (Table 2).
|
BMI
Classification Categories
|
BMI
|
BFPR Classification Categories
|
BFPR (M ± SD)
|
BFPR (percentiles)
|
|||
|
M
|
F
|
Classification Categories
|
F
|
M
|
F
|
||
|
%
|
%
|
%
|
%
|
%
|
%
|
||
|
Deficit
|
1,9
|
1,5
|
Fat deficit
|
8,39
|
0,00
|
34,8
|
0,3
|
|
Normality
|
38,1
|
32,7
|
Less deficit
|
51,61
|
1,3
|
65,2
|
71,9
|
|
Obesity Grade I
|
15,5
|
18,1
|
Adequate grease
|
40,00
|
77,9
|
0,0
|
14,1
|
|
Obesity Grade II
|
2,6
|
5,0
|
Obesity
|
0,00
|
2,5
|
0,0
|
0,0
|
|
Obesity Grade III
|
0,0
|
0,5
|
|
0,00
|
0,0
|
0,0
|
0,0
|
|
Overweight
|
41,9
|
42,2
|
Overweight
|
0,00
|
18,3
|
0,0
|
13,7
|
|
TOTAL
|
100,0
|
100,0
|
Total
|
100,0
|
100,0
|
100,0
|
100,0
|
Table 2. Comparison of BMI classification with PGCR, classified according to percentiles and M±SD
It should be noted above that the BFPR equation and the BFPD equation are highly correlated (0.97); However, the first has been selected because it is an equation obtained in a sample made up of Venezuelan older adults, and is the one that has given a lower estimation error than that of other equations.
Additionally, the equation was evaluated through the Analysis of Variance, which showed that the equation obtained by regression and which includes the variables BMI, WC and sex, has a coefficient of determination equal to 1, correlation equal to 1 and a typical error of practically 0; the F-test for regression indicates that this equation is reliable and statistically significant (p <0.000). The formula of the equation is:
BFPR = 11.4878+1.0409*BMI+0.0431*WC- 11.1795*Sex
The association between BFPR and Arterial Hypertension (HTN) was determined by means of the Chi-square independence test, and a value of 0.06 was obtained, which indicates that the presence of HTN in older adults is associated with BFPR; that is, HTA is not independent of BFPR.
Sensitivity, specificity, positive predictive value and negative predictive value were calculated. Therefore, the sensitivity is 80.0%, that is, the BFPR identifies 80.0% of adults who are not at risk and do not suffer from hypertension; specificity is 20.3% indicating that the BFPR identifies only 20.3% of older adults who have hypertension.
In the association of the equation of BFPR with hypertension, a sensitivity of 81.4% has been obtained for the total sample, 100.0% for the male sex and 77.3% for the female sex, differing from the specificity on the contrary is very low, since it is 18.1% for the total sample, 0.0% for the male sex and 20.5% for the female sex (Table 3).
|
BFPR
|
Total
|
Male
|
Female
|
||||||
|
No
|
Yes
|
T
|
No
|
YES
|
Total
|
No
|
Yes
|
Total
|
|
|
No Risk
|
118
|
253
|
371
|
26
|
36
|
62
|
92
|
217
|
309
|
|
Risk
|
27
|
56
|
83
|
0
|
0
|
0
|
27
|
56
|
83
|
|
TOTAL
|
145
|
309
|
454
|
26
|
36
|
62
|
119
|
273
|
392
|
|
Sensitivity
|
81,4%
|
|
100,0%
|
|
77,3%
|
||||
|
Specificity
|
18,1%
|
|
0,0%
|
|
20,5%
|
||||
|
PPV
|
31,8%
|
|
41,9%
|
|
29,8%
|
||||
|
VPN
|
67,5%
|
|
0,0%
|
|
65,5%
|
||||
Table 3. Relationship between BFPR and HT, excluding the fat deficiency category. Sensitivity, Specificity, Positive predictive value and negative predictive value
Similarly, it was verified, through the Chi square independence test, that diabetes mellitus is associated with BFPR, since a value of 2 = 0.1161 was obtained, which is statistically significant (p<0.000). In the association of BFPR with diabetesmellitus, a sensitivity of 80.3% was obtained for the total sample, 100.0% for males and 79.2% for females; specificity was very low, 21.0% for the total sample, 0.0% for males and 20.0% for females (Table 4).
|
|
Diabetes Mellitus II
|
Male
|
Female
|
||||||
|
BFPR
|
0
|
1
|
T
|
0
|
1
|
T
|
0
|
1
|
T
|
|
No Risk
|
323
|
113
|
436
|
45
|
17
|
62
|
226
|
80
|
306
|
|
Risk
|
79
|
30
|
109
|
0
|
0
|
0
|
63
|
20
|
83
|
|
TOTAL
|
402
|
143
|
545
|
45
|
17
|
62
|
289
|
100
|
389
|
|
Sensitivity
|
80,3%
|
|
100,0%
|
|
79,2%
|
||||
|
Specificity
|
21,0%
|
|
0,0%
|
|
20,0%
|
||||
|
PPV
|
74,1%
|
|
73,6%
|
|
73,9%
|
||||
|
VPN
|
28,3%
|
|
0,0%
|
|
24,1%
|
||||
Table 4. Relationship between BFPR and diabetes mellitus, excluding the fat deficiency category. Sensitivity, Specificity, Positive predictive value and negative predictive alue
The application of the Chi-square independence test resulted in 2 = 0.1845, a value that is statistically significant (p<0.000), therefore osteoporosis is associated with BFPR, a sensitivity of 79.1% has been obtained for the total sample, 82.5% for males and 78.9% for females; specificity was found to be very low, 19.4% for the total sample, 20.1% for males and 22.0% for females (Table 5).
As in the previous cases, the independence test between the BFPR and neuropsychic diseases was applied, and a value of 2 = 0.2609 was obtained, which is statistically significant (p < 0.000). Equal sensitivity 80.4%, specificity 21.8%, positive predictive value 80.5% and negative predictive value 21.6% were determined for the sample; For each sex, sensitivity values 100.0%, specificity 0.0%, positive predictive value 78.7% and negative predictive value 0.0% for males, and sensitivity 72.9%, specificity 31.2%, positive predictive value 81.4% and negative predictive value 21.6% for females were obtained.
|
|
Osteoporosis
|
Male
|
Female
|
||||||
|
PGCR
|
0
|
1
|
T
|
0
|
1
|
T
|
0
|
1
|
T
|
|
No Risk
|
201
|
241
|
442
|
58
|
74
|
132
|
143
|
167
|
310
|
|
Risk
|
53
|
58
|
111
|
17
|
11
|
28
|
36
|
47
|
83
|
|
TOTAL
|
254
|
299
|
553
|
75
|
85
|
160
|
179
|
214
|
393
|
|
Sensitivity
|
|
|
79,1%
|
|
|
82,5%
|
|
|
78,9%
|
|
Specificity
|
|
|
19,4%
|
|
|
20,1%
|
|
|
22,0%
|
|
PPV
|
|
|
45,5%
|
|
|
79,0%
|
|
|
46,1%
|
|
VPN
|
|
|
52,3%
|
|
|
76,6%
|
|
|
56,6%
|
Table 5. Relationship between PGCR and osteoporosis, excluding the fat deficiency category. Sensitivity, Specificity, Positive predictive value and negative predictive alue
|
|
Neuropsychic Diseases
|
Male
|
Female
|
||||||
|
PGCR
|
0
|
1
|
T
|
0
|
1
|
T
|
0
|
1
|
T
|
|
No Risk
|
356
|
86
|
442
|
122
|
33
|
155
|
234
|
53
|
287
|
|
Risk
|
87
|
24
|
111
|
0
|
0
|
0
|
87
|
24
|
111
|
|
TOTAL
|
443
|
110
|
553
|
122
|
33
|
155
|
321
|
77
|
398
|
|
Sensitivity
|
80,4%
|
100,0%
|
72,9%
|
||||||
|
Specificity
|
21,8%
|
0,0%
|
31,2%
|
||||||
|
PPV
|
80,5%
|
78,7%
|
81,4%
|
||||||
|
VPN
|
21,6%
|
0,0%
|
21,6%
|
||||||
Table 6. Relationship between BFPR and neuropsychic diseases, excluding the fat deficiency category. Sensitivity, Specificity, Positive predictive value and negative predictive value
The analysis of variance reveals that the variables are statistically significant, which makes the equation valid and reliable to estimate the Body Fat Percentage (BFPR) through the Regression based on the variables BMI, WC and Sex, because it also has a lower estimation error and a higher coefficient of determination. Bivariate correlations were obtained, which are weight-WC (0.7517), weight-BMI (0.8007), BMI-WC 0.7477), BFPD-BMI (0.7155), BFPR-BMI (0.7374) and BFPD-BFPR (0.9722).
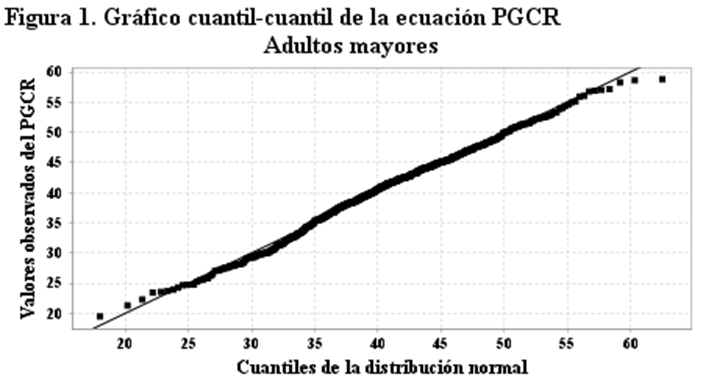
The Shapiro-France normality contrast (Shapiro- France) was applied, revealing that the value of the W=0.985 statistic is statistically significant, therefore the regression model obtained by regression based on the variables BMI, WC and Sex, used to estimate Body Fat Percentage is normally distributed; that is, the data or values of this variable come from a population that is normally distributed, which can be verified by viewing the quantile-quantile graph (Figure 1).
Logistic Regression was applied, in order to evaluate the Percentage of Body Fat obtained through Regression (BFPR), as a useful model to evaluate overweight and obesity in older adults, and the following statistical indicators were obtained. The likelihood quotient resulted in a Statistic R = 505.88 which is statistically significant (p<0.000), therefore the hypothesis that establishes that the relationship between BFPR and risk, that is, overweight and obesity, is reliable and valid; The coefficient of determination is 0.906. The coefficients of each variable used in the BFPR estimation model were obtained, which are:
|
Variable
|
Coefficient
|
USA
|
Wald
|
P-value
|
|
Constant
|
-56,790
|
4,778
|
-11,886
|
0,000
|
|
BMI (Kg/m2)
|
1,911
|
0,165
|
11,589
|
0,000
|
|
WC (cm)
|
0,749
|
0,748
|
1,001
|
0,317
|
|
Sex
|
-14,493
|
1,453
|
-9,975
|
0,000
|
Table 4. Coefficients of the regression equation according to Logistic Regression
The OR indicate the contribution made by each of the variables in the application of the model to estimate the risk, according to the Percentage of Body Fat obtained by regression (BFPR), in this case the one that contributes the most is the BMI, followed by the WC. Odds Ratio of each variable
|
Variable
|
OR
|
CI (95.0 %)
|
|
|
BMI (Kg/m2)
|
6,757
|
4,891
|
9,334
|
|
CC (cm)
|
2,115
|
0,488
|
9,167
|
|
Sex
|
0,000
|
0,000
|
0,000
|
The goodness-of-fit test shows that the value of the c 2 = 15.8 statistic is statistically significant. Goodness of fit test
|
Statistician &chi ;²
|
Gl
|
P-value
|
|
15,803
|
9
|
0,071
|
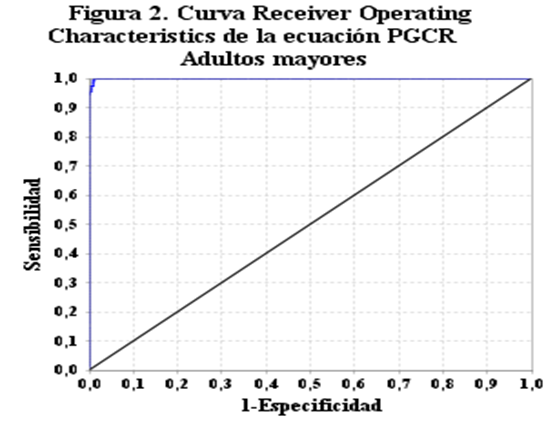
The Receiver Operating Charateristics (ROC) curve is presented in Figure 2, and it can be seen that it distances from the diagonal, which allows us to affirm that the regression equation based on the variables BMI, WC and Sex, is a good estimator for the Percentage of Body Fat in older adults.
In this curve you can identify the Sensitivity and Specificity, which identified at the coordinate point (1.0; 1.0), indicating that the regression model has a Sensitivity of 100.0% and a Specificity of 100.0%. In addition, the standard error is practically equal to 0, and the area under the curve is equal to 1.
|
Area under the curve
|
Standard error
|
CI (95.0 %)
|
|
|
1,000
|
0,001
|
0,997
|
1,000
|
According to this result, the BMI variables as a continuous variable, and the WC and sex variables as dichotomous variables, included in the Logistic Regression, of the regression equation to estimate the Body Fat Percentage (PGCR) to estimate risk, turn out to be significant; That is, the model is reliable for predicting risk in older adults.
Discussion
Let’s start by sharing what the WHO said, in the sense that the extension of life expectancy offers opportunities to older people, their families and society; Likewise, older people contribute to their families and communities, but for this they must have a good state of health [1].
On the other hand, PAHO, referring to healthy aging, states that the number of older persons is currently increasing exponentially, in complex and uncertain economic circumstances, which is why timely interventions will enhance the contribution of this population group to social development, thus preventing it from becoming a crisis factor for the health structure and social security of the Americas [2].
Considering the above, it is very useful to have available an indicator that is complementary to BMI, to assess risk in older adults, in order to have reliable elements to evaluate the health status of this population group.
The results show that the average age and BMI are similar in the two sexes; the averages of weight, height and WC are higher in men, and the averages of BFPD and BFPR are similar in the two formulas, and higher in women.
When considered by age group and sex, it is necessary that for the group 60 to 69 years, the average age and BMI are similar; average weight, height, and WC are higher in men, and higher averages in BFPD and BFPP in women; all are statistically significant, with the exception of age and BMI. For the 70 to 79 age group, mean weight, height, and WC higher in men, and mean age, higher BFPD and BFPR in women, and similar BMI averages; all are statistically significant, with the exception of age and BMI. For the 80 and over age group, the age averages are similar; average weight and height higher in men; higher mean WC, BMI, BFPD, and BFPR in women; when these averages are compared, it turns out that age, weight, WC and BMI are not significant, and the averages of height BFPD and BFPR are statistically significant.
The comparison regarding the classification of BMI and BFPR, according to the two classification criteria, show that in the deficit category the BMI locates lower percentages, unlike in the normal category the BFPR locates higher percentages of agreement with the two criteria, in overweight the BMI locates very high percentages, and the BFPR only places percentages in the female sex, finally the BMI locates percentages, for both sexes in obesity, and the BFPR, according to the M±SD criterion, places a very low percentage only in the female sex.
The normality contrast was applied to the BFPR equation, and it was obtained that the Shapiro-France contrast reveals that the equation model is statistically significant, and behaves as a normal distribution, the W = 0.995 statistic and the p value = 0.059. Likewise, the contrast of Asymmetry and Kurtosis reveals that the statistic X2 = 4.309 is statistically significant and the model is valid and reliable. Finally, the quantile- quantile graph shows that all points are located on the diagonal. The review of articles related to the percentage of body fat allows us to compare some results with those obtained in this study; for example, Huerta-Huerta et al [24], tested an equation based on anthropometric measurements and obtained BFP averages of 23.6±7.8 and 29.1±9.1 in men and women, which are lower than those obtained in this study.
On the other hand, a study by Oleas Galeas et al [4]. reveals that the height decreases by about 10 cm from the age of 60, coinciding with this study, in addition it is observed that the weight also decreases approximately 10 kg.
Ramírez Ramos [25]. cites in an article that some studies have found that body fat decreases unfavorably for the health of the elderly, and increases the amount of adipose tissue in the central part of the body, which constitutes a risk factor; This is reflected in the CC averages obtained in this study, which increases from 60 years to 79 years. Bauce [26]. evaluated a group of elderly patients and obtained 69.1% overweight in men and 62.9% in women, according to BMI, values higher than those of this study (49.1% and 42.2%, respectively).
Conclusion
Based on the results and the discussion, it can be concluded that the formula to estimate the percentage of body fat in older adults, based on regression and including the variables BMI, WC and sex, may be useful to evaluate risk in this population group, considering that the estimated values behave as a normal distribution, It is associated with antecedents such as high blood pressure, diabetes mellitus, osteoporosis and neuropsychiatric diseases.
References
- WHO. Aging and health. Press center. October 1, 2022. (Internet) (Cited 2023 Jun 20) Available in:
- Saucedo-Pahua, Gerardo, Juan Alberto López-González, Anel Gómez-García, Jack Roberto Silva Fhon, and María De Jesús Jiménez-González. "Transition to the Role of Family Caregiver of Older Adults After a Stroke: A Specific Theory." Aquichan 23, no. 3 (2023).
- Venezuelan Program of Education Action in Human Rights (Provea). The elderly in the crisis. 12 October 2016. (Internet) (Cited 2023 Jun 22) Available from
- Oleas Galeas, Mariana, Amparito Barahona, and Raquel Salazar Lugo. "Body mass index and fat percentage in adults Ecuadorian indigenous Awá." (2017): 42-48.
- Borkan, Gary A., Stephen G. Gerzof, Alan H. Robbins, D. E. Hults, C. K. Silbert, and J. E. Silbert. "Assessment of abdominal fat content by computed tomography." The American journal of clinical nutrition 36, no. 1 (1982): 172-177.
- Collins, Mitchell A., Melinda L. Millard-Stafford, Phillip B. Sparling, Teresa K. Snow, Linda B. Rosskopf, Stephanie A. Webb, and Jay Omer. "Evaluation of the BOD POD for assessing body fat in collegiate football players." Medicine and science in sports and exercise 31, no. 9 (1999): 1350-1356.
- Fuller, N. J., C. R. Hardingham, M. Graves, N. Screaton, A. K. Dixon, L. C. Ward, and M. Elia. "Assessment of limb muscle and adipose tissue by dual-energy X-ray absorptiometry using magnetic resonance imaging for comparison." International journal of obesity 23, no. 12 (1999): 1295-1302.
- Lozano-Berges, Gabriel, Alejandro Gómez-Bruton, Ángel Matute- Llorente, Cristina Julián-Almárcegui, Alba Gómez-Cabello, Alejandro González-Agüero, José A. Casajús, and Germán Vicente-Rodríguez. "Assessing fat mass of adolescent swimmers using anthropometric equations: A DXA validation study." Research Quarterly for Exercise and Sport 88, no. 2 (2017): 230-236.
- Isjwara, Ratih I., Widjaja Lukito, and Jan Werner Schultink. "Comparison of body compositional indices assessed by underwater weighing, bioelectrical impedance and anthropometry in Indonesian adolescent girls." Asia Pacific journal of clinical nutrition 16, no. 4 (2007).
- Vio del Río, Fernando, Alejandra Domper Rodríguez, Carmen Gloria González González, Lilian Fonseca Morán, Lorena Barrios Lamas, and Isabel Zacarías Hasbún. "20 años: programa 5 al día en Chile: promoviendo el consumo de frutas y verduras." (2023).
- Vanegas Bravo, Marcia Alexandra. "Prevalencia y Factores Asociados al Sobrepeso en estudiantes de Ciencias de la Salud, Universidad de Cuenca, 2016." (2018).
- González Sandoval, Claudia Elena, Yolanda Díaz Burke, Adriana Patricia Mendizabal-Ruiz, Eunice Medina Díaz, and José Alejandro Morales. "Prevalencia de obesidad y perfil lipídico alterado en jóvenes universitarios." Nutrición Hospitalaria 29, no. 2 (2014): 315-321.
- Carvalho, Carolina Abreu de, Poliana Cristina de Almeida Fonseca, José Bonifácio Barbosa, Soraia Pinheiro Machado, Alcione Miranda dos Santos, and Antonio Augusto Moura da Silva. "Associação entre fatores de risco cardiovascular e indicadores antropométricos de obesidade em universitários de São Luís, Maranhão, Brasil." Ciência & saúde coletiva 20, no. 2 (2015): 479-490.
- Bauce, Gerardo Jose. "Association of Body Fat Percentage with History pathological in older adults." (2024).
- National Institute of Nutrition. Overweight and Obesity in Venezuela. Prevalence and conditioning factors. Editorial Fund Corn People. [Internet]. Caracas, 2012. [Cited 2023 May 29] Available from:
- World Medical Association Declaration of Helsinki. Ethical Principles for Medical Research. Involving Human Subjects. Special Communication. October 2013. (Internet) (Cited 2023 Mar 20). Available in:
- Villasís-Keever, Miguel Ángel, Horacio Márquez-González, Jessie Nallely Zurita-Cruz, Guadalupe Miranda-Novales, and Alberto Escamilla-Núñez. "Research protocol VII. Validity and reliability of the measurements." Revista Alergia Mexico 65, no. 4 (2018): 414-421.
- Sánchez, Núñez, and Reyes Huarcaya RME. "Importance of differentiating cutoff points from BMI according to age." Nutricion hospitalaria 34, no. 5 (2017): 1263-1263.
- Bauce, Gerardo. "Índice de masa corporal, peso ideal y porcentaje de grasa corporal en personas de diferentes grupos etarios." Revista Digital de Postgrado 11, no. 1 (2022): e331-e331.
- Bauce, Gerardo Jose. "Association of Body Fat Percentage with History pathological in older adults." (2024).
- Bauce, Gerardo Jose. "Association of Body Fat Percentage with History pathological in older adults." (2024).
- Ciclobr. Waist circumference measured to know the cardiovascular risk and Alzheimer’s. [Internet] February 2008 [Cited: 2023 Mar 14] Available in:
- National Institute of Nutrition. Obesity and Overweight in Venezuela (Prevalence and Conditioning Factors) People of Maíz: Caracas; 2012.
- Huerta-Huerta R, Esparza-Romero J, Urquidez R, Pacheco BI, Valencia ME and Alemán-Mateo H. Validity of an anthropometry- based equation for estimating body fat in older adults. ALAN v.57 n.4 Caracas dec. 2007. (Internet) (Cited 2023 Jun 29) Available from:
- Ramírez Ramos AG The importance of weight and body composition in the elderly. The Catholic University (UNIVA). Puerto Vallarta. (Internet) (Cited 2023 Jun 29) Available from:
- Bauce GJ. Anthropometric evaluation of a group of older adults. Rev Digit Postgraduate 9(2) Jun 2020. DOI: 10.37910/ RDP.2020.9.2.e225 (Internet) (cited 2023 Jun 29) Available from:


