
Research Article | DOI: https://doi.org/10.58489/2836-5038/007
Department of Biology, Faculty of Education, University of Khartoum, Sudan.
*Corresponding Author: Asaad Alsiddig Ahmed
Citation: Lina Ahmed Hassaballa and Asaad Alsiddig Ahmed, (2023). Molecular Genetic Identification of Some Sweet Sorghum - Sorghum bicolor L. (Ankolib) Accessions - Sudan. International Journal of Stem cells and Medicine. 2(1). DOI; 10.58489/2836-5038/007.
Copyright: © 2023 Asaad Alsiddig Ahmed, this is an open access article distributed under the Creative Commons Attribution License, which permits unrestricted use, distribution, and reproduction in any medium, provided the original work is properly cited.
Received: 16 January 2023 | Accepted: 24 January 2023 | Published: 31 January 2023
Keywords: ankolib, sweet sorghum, molecular genetics
This study is an attempt to identify some Sudanese Sweet Sorghum (Ankolib) [Sorghum bicolor (L.) Moench.] accessions using two types of DNA-based markers: RAPD and SSR. Seven (Ankolib) accessions were assayed, namely: Black Ankolib, Black White Ankolib, Dark Red Ankolib, Red Yellow Ankolib, White Ankolib, White Black Ankolib and Bengaga. All of the accessions were uniquely identified and fingerprinted. The levels of polymorphism among the accessions as revealed by (22) RAPD primers and (16) SSR primer pairs were (58%) and (76%) respectively, indicating that SSRs markers were highly polymorphic. The scored data of the two markers were analyzed using the Dice Coefficient to assess genetic relationships among the (7) (Ankolib) accessions. The results of the statistical analysis revealed that the accession Bengaga was distantly related to the other (6) accessions which all showed a close genetic similarity among them. UPGMA cluster analysis generated a dendrogram for each marker alone and for the combined data of the two markers. It was observed that in all of the dendrogram the accession Bengaga was found in a unique cluster thus indicating its uniqueness, since it is the only accession that has seeds that produce flour besides its juicy sweet stem.
The classification and identification of all known plants have gradually shifted from purely artificial systems to more accurate systems that are based on genetic experimentations. This development of Plant Taxonomy is a reflection of the development and application of new techniques. Taxonomists have now made the new techniques applied in the field of Ecology, Histology, Physiology, Biochemistry, Cytogenetic and Molecular Biology. The accurate, fast, reliable and cost-effective identification of plant population and varieties is essential in agriculture as well as in pure and applied plant research. Methods of varietals identification are most frequently based on assessment of a range of morphological characteristics, while these methods are very effective for many purposes, morphological comparison may have limitations including subjectivity in the analysis of the character, the influence of environmental or management practices on the character limited diversity among cultivars with highly similar pedigrees and the confining of expression of some diagnostic characters to a particular stage of development, such as flowering and fruit ripening. These considerations have led to the exploration or adoption of other techniques for varietals identification [1]. New techniques based on DNA profiling provide novel approaches to varietals identification which offer advantages over all of other techniques (Fig. 8 & 10) and methods for demonstrating distinctness because: 1/ The DNA sequence of an organism is unique and independent of environmental conditions or management practices. 2/ The presence of the same DNA in every living cell of the plant allows tests of any tissue at any stage of growth (provided that the DNA is sufficient purity).3/ The recent advent of the polymerase chain reaction PCR has enabled the development of new DNA profiling techniques Table (3) that are simply and quickly performed. Therefore, attention has increasingly focused on the DNA molecule as a source of informative polymorphisms. DNA profiling techniques have two applications: 1/ DNA Fingerprinting, identifies individuals by the unique profile produced when their DNA is separated into a series of fragments and resolved into sized classes. This technique has potential in the specific identification of plant cultivars and their subsequent protection. 2/ Gene Mapping allows researchers to mark genes or chromosomes regions that are related to genetic traits such as pests or disease resistance, fruit size, fruit color and stress- tolerance…etc.
A particular advantage of such technique is that complex polygenic traits can be analyzed. Mapping techniques can also be used to isolate genes based entirely on their behavior. Once these have been identified, sequenced and cloned. Gene transfer techniques can be used to transfer them to other species. The sustainable development of large areas of the world is today one of the greatest challenges. The living conditions of large parts of the world population are greatly affected by the availability of energy, together with food and water. As most developing countries have limited fossil fuel indigenous resources, import of energy fills the increasing difference between demand and production. Consequently, nowadays a large number of motivation and a growing interest exist for the development of renewable sources of energy, like energy systems based on biomass, in particular energy crops, such as sweet sorghum.
Sweet sorghum has been selected as the main biomass resource for the following reasons:
- It has a very high yield (up to 80 tons/ha. of fresh matter) in terms of starch, sugar, ligno–cellulosic component and today can be considered as the most versatile and promising crop (food-feed-energy(.
- It has two times the photosynthetic efficiency in comparison with Sugar Beet, Soybean, Wheat…etc., (Its photorespiration can almost not be measured).
- It can be grown in a wide range of latitudes (tropical, sub- tropical and temperate zones) as well as on poor quality soil.
- It requires very low fertilizer and water input. The water requirement for growing sweet sorghum is one of the lowest: about 1/2 of the requirement for corn and about 1/3 of the requirement for sugar cane.
- Its growth period is short (4-5 months) in comparison with Sugar cane (8-24 months). The versatility of sweet sorghum is reflected in the range of research going on around the world into sweet sorghum production.
- It is a low water-use, stress tolerant crop with considerable potential for future small and large-scale exploitation. All these benefits and the importance of the sweet sorghum as the most promising (food-feed-energy) crop for the twenty-first century and its potential to aid development encourage the author to carry out this study. In this study we are going to identify some sweet Sorghum bicolor (L.) Moench. accessions in Sudan, using DNA-based markers like random amplified polymorphic DNA (RAPD) and simple sequence repeats (SSRs). Fig. (9).
Sweet Sorghum bicolor (L.) Moench. which represents the scope of this study, belongs to the family Gramineae (Poaceae). It can be classified as follows:
Kingdom: Plantae
Subkingdom: Tracheobionta
Superdivision: Spermatophyta
Division: Magnoliophyta
Class: Liliopsida
Subclass: Commelinidae
Order: Cyperales (Poales)
Family: Gramineae (Poaceae)
Genus: Sorghum Moench.
Species: Sorghum bicolor (L.) Moench
Sorghum is a vigorous grass that varies between (0.5-5.0 m.) in height. It is an annual plant. It produces one or many tillers, which emerge initially from the base and later from stem nodes. The root system consists of fibrous adventitious roots that emerge from the lowest nodes of the stem, below and immediately above ground level. Roots are normally concentrated in the top (0.9 m.) of soil but may extend to twice that depth and can extend to (1.5 m.) in lateral spread. The stem is solid, usually erect. Its center can be dry or juicy, insipid or sweet to taste. The center of the stem can become pithy with spaces. Leaves vary in number from (6 – 24), depending on the cultivar. They are borne alternately in two ranks. Leaf sheaths vary in length between (15 - 35 cm.) and encircle the stem with their margins overlapping. The leaf sheath often has a waxy bloom. Leaves are from (30 - 135 cm.) long and (1.5 - 13 cm.) wide, with flat or wavy margins. Midribs are white or yellow in dry pithy cultivars or green in juicy cultivars. The inflorescence is a panicle, usually erect, but sometimes recurved to form a goose neck. The panicle has a central rachis, with short or long primary, secondary and sometimes tertiary branches, which bear groups of spikelets. The length and closeness of the panicle branches determine panicle shape, which varies from densely packed conical or oval to spreading and lax. The grain is usually partially covered by glumes. The seed is rounded and bluntly pointed, from (4 - 8 mm.) in diameter and varying in size, shape and color with cultivar.
Sorghum originated in the north-eastern quadrant of Africa, where the greatest variability in wild and cultivated species is found to this day. It was probably domesticated in Ethiopia by selection from wild sorghum between (5.000 and 7.000) years ago. From this center of origin, it was distributed along trade and shipping routes throughout Africa, and through the Middle East to India at least (3.000) years ago. It reached China along the silk route. Sorghum was first taken to America through the slave trade from West Africa. It was reintroduced in late 19th century for commercial cultivation and has subsequently been introduced into South America and Australia. Although wild varieties of sorghum are attested as early as (8.000) years ago in the Nilotic regions of southern Egypt and Sudan, the location of its true domestication within East Africa is still speculative. It is widely held that genetics separation of domesticated Sorghum bicolor L. from its progenitor did not occur much before (2.000) years ago somewhere in East Africa, possibly the Ethiopian highlands, but more likely further west. The presence of true domesticated S. bicolor L. is claimed much earlier than this (3.700 – 4.900) years ago in India, Oman and Yemen, although the identity of the remains as full domesticates is still disputed. Sorghum is now widely found in the drier areas of Africa, Asia, America and Australia.
Sweet Sorghum bicolor (L.) Moench. is the only crop that provides grain and stem that can be used for sugar, alcohol, syrup, jaggery, fodder, fuel, bedding, roofing, fencing, paper and chewing [2]. Sweet sorghum has been widely used for the production of forage and silage for animal feed. It has also been used for nearly (150) years to produce concentrated syrup with a distinctive flavor [3]. [4] mentioned that, the primary products from sweet sorghum are based on exploiting the high levels of sugars found in the stem. These products include: Ethanol, Syrup, and Crystalline sugar, Electricity (produced from burning the residual fiber and Particle board or paper (from the fiber) Sucrose–type sweet sorghum, which mainly contains sucrose, can be used for refining crystal sugar. Syrup-type sweet sorghum, which mainly contains glucose, can be used for producing syrup; it is also a material of quality for making drinking wine and alcohol. [4], also noted that sweet sorghum has a medicinal use, the inflorescence has astringent, haemostatic and antidiarrhea properties and can be administered as infusion, tincture and medicinal wine. The stem is used in Nigerian traditional medicine for the treatment of anemia, especially during pregnancy. The oil crisis of (1973) and (1976) renewed interest in the commercial production of sweet sorghum for biological transformation into ethyl alcohol for use as fuel or fuel additive [5]. In Sudan grain sorghum contributes about (39%) of the calories in the human diet, while sweet sorghum is mainly used as fodder. In Sinnar Locality. The grains are ground and used as especial flour.
Recent advances in Molecular Biology, principally in the development of the polymerase chain reaction (PCR) for amplifying (DNA), (DNA) sequencing and data analysis have resulted in powerful techniques which can be used for the screening, characterization and evaluation of genetic diversity. The extensive number of research articles currently appearing in the literature, describing the use of these techniques in a wide range of plant species and diversity problems, is testimony to their increasing impact in this field. Application of (DNA) technology in seed research has progressed rapidly during the last ten years, especially in the area of cultivar identification. DNA fingerprinting technique has a promising application in this respect. A cultivar identification test based on (DNA) genetic fingerprints would be much faster than the official methods of variety identification, which require growing of suspect plants to the flowering stage, in parallel with control plants [6]. Reported that the use of DNA-based markers for the genetic analysis and manipulation of important agronomic traits has become an increasing useful tool in plant breeding. DNA markers have the potential to enhance the operation of plant breeding programs through a number of ways ranging from genetic diversity, increasing the efficiency of selection for difficult traits and making environmental neutral selection possible. The problem of (DNA) extraction is still an important issue in the field of plant molecular biology. A good extraction procedure for the isolation of (DNA) should yield adequate and intact (DNA) of reasonable purity. The procedure should also be quick, simple and cheap. DNA extraction is difficult in a variety of plants because of the presence of metabolites that interfere with (DNA) isolation procedures and downstream applications such as DNA restriction, amplification and cloning [7]. Various plants contain high levels of polysaccharides and many types of secondary metabolites affecting (DNA) purification. A good protocol for the isolation of (DNA) from leaf material containing large quantities of polyphenol, tannins and polysaccharides was reported by [8] using modified CTAB extraction method by applying high salt concentrations to remove polysaccharides and PVP to remove polyphenols. This modified CTAB protocol was used by [7] for (DNA) extraction from dry and fresh leaves of pearl millet (Pennisetum glaucum), they mentioned that this method solved the problems of (DNA) degradation, contamination and low yield due to binding and/or co-precipitation with starches and polysaccharides. [9] reported that, the knowledge of genetic relationships and distance among individuals provide useful information for breeders, and this can then be exploited to obtain the benefit from the potential of each population. They also stated that, molecular-assisted genetic analysis provide means to locate and select genes controlling important agronomic, pest-resistance, stress-tolerance and food quality traits. Genetic relationships facilitate the identification of diverse parents to cross in hybrid combination in order to maximize the expression of heterosis [10]; [11] and [12]. In India [13] reported that two sweet sorghum varieties (S21-3-1 and S23-1-1) were developed by crossing American lines with a local variety. These two varieties were found to be useful for their sugar content to produce ethanol and their grains to produce flour. Analysis of the extent and distribution of genetic variation in a crop is essential in understanding the evolutionary relationship between accessions and to sample genetic resources in a more systematic fashion for breeding and conservation purposes [14]. [15] mentioned that accurate identification of new varieties is essential to plant variety protection. The plant variety protection act (PVPA) of (1970) was established to help plant breeders protect their crop cultivars from commercial exploitation by others. DNA-based markers played a great role in this respect since they provide unique (DNA) fingerprints for plant varieties and cultivars ensuring their protection under the (PVPA). Various techniques have been used to mark individual characters in segregating population and constructing genetic maps. Initially, isozymes were used as markers. Recently, more precise marker techniques such as: RFLPs, RAPDs, AFLPs VNTRs and SSRs were widely used [16]. Each marker technique has its own advantages and disadvantages. The choice of a molecular marker technique depends on its reproducibility and simplicity. DNA markers are used to evaluate the genetic variation in gene banks, as well as to identify phylogenetic and molecular structure of crops and their associated wild species.
PCR based marker like random amplified polymorphic (DNA) (RAPD) was developed independently by [17] and [18]. This technique was widely used to fingerprint a wide range of species from microorganisms to human. In plants, the technique is used to identify Wheat, Maize, Date, Palms, Corn and Soybean. cultivars the appeal of this technique was largely due to its ease in applications. However, the random nature of the primers makes the results non-reproducible. The advantages of this technique are: - The markers used seem to be virtually unlimited and are present in all organisms. - RAPD markers have a great potential to detect (DNA) Polymorphism between genotypes of the same species. Random amplified polymorphic DNA (RAPD) is quick [19]; [20] and well adapted for nonradioactive DNA fingerprinting of genotypes [21]. However, problems with the reproducibility in amplification of RAPD markers and with data scoring have been reported [22]. Although major bands from RAPD reaction are highly reproducible, minor bands can be difficult to repeat due to the random priming nature of this PCR reaction and potential confounding effects associated with co-migration with other markers [23]; [14] used (5) RAPD primers to fingerprint and detect the relationships among (17) sorghum cultivars, (11) Egyptian cultivars and (6) Yemenian cultivars. They reported that total number of (34) polymorphic bands with a level of (94%) polymorphism succeeded to discriminate the sorghum cultivars. [25] assayed (51) RAPD primers to determine the genetic distance among (8) Egyptian sweet sorghum cultivars. They found that (49) primers generated total number of (314) bands which were not necessarily present in each cultivar. (206) bands were found to be polymorphic and (108) bands were common in all of the eight cultivars. The dendrogram tree generated across the (49) primers divided the (8) cultivars into four clusters.
The data showed different levels of variation among these cultivars.
Simple sequence repeats (SSRs) or microsatellites [26] generates a large number of restriction fragments (bands) facilitating the detection of polymorphism which is based on the number of repeat units in a defined region of the genome under investigation Table (3). SSRs are ubiquitous in eukaryotes. The number and composition of microsatellite repeats differ in plants and animals. The frequency of repeats longer than (20 bp.) has been estimated to occur every (33) kb in plants unlike mammals where it is found to occur every (6 kb.) [27]. In human, (AC) or (TC) are very common repeat units, but in plants AT is more common followed by AG or TC [28]. In general, plants have (10) times less SSRs than human. [29] Noted that the common SSRs in sorghum are: AG, AC, AAC and AAG. SSR markers are attractive for DNA fingerprinting studies for several reasons. They are co-dominant and highly informative, occur in high frequency and appear to be distributed throughout the genomes of most if not all of the higher plants and animals. SSRs generally, display high levels of polymorphism even among closely related accessions [30] and amenable to automated genotyping strategies. They also can be amplified by inexpensive PCR assays. Radioisotopes are not required in the detection of SSR markers because sequence polymorphism can usually be detected by separation. Most of Sorghum bicolor L. SSR loci showed a high level of polymorphism.
Preparation of Plant Materials:
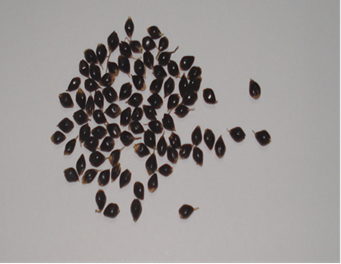
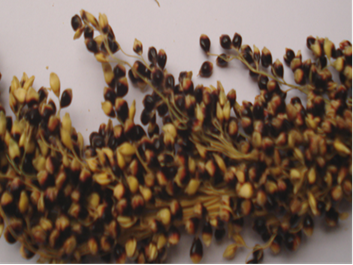
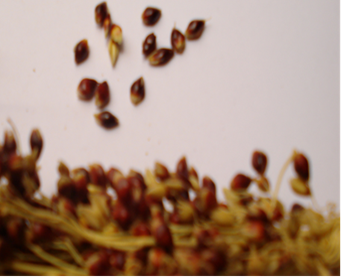
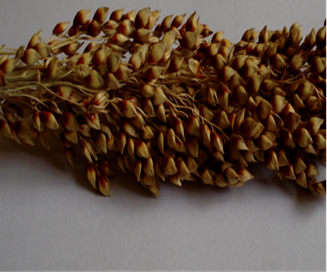
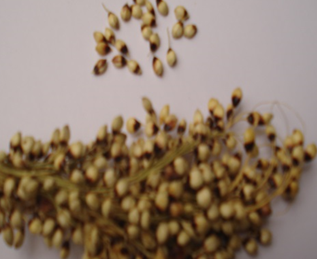
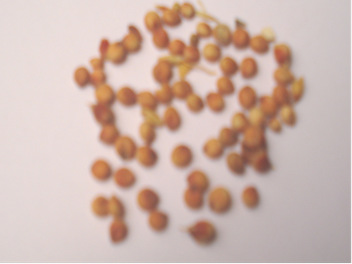
Seeds of (7) sweet sorghum (Ankolib) accessions, namely, Black Ankolib Fig. (1), Black White Ankolib Fig. (2), Dark Red Ankolib Fig. (3), Red Yellow Ankolib Fig. (4), White Ankolib Fig. (5), White Black Ankolib Fig. (6) and Bengaga Fig. (7), were collected by the author from three different sites in Sudan. Names of accessions, sites of collection, glume color and seed color have been shown in Table (1). Similarly, the glume colors for the accessions have been indicated. The seed color of the accession Bengaga is illustrated.
Preparation of Solutions
1 -Extraction buffer: consist of 2% CTAB (w/v), 100mm. Tris pH (8.0), (20mM EDTA (pH 8.0), (1.4) m. NaCL and (0.03%) β-mercaptoethanol (50µl/sample).
2 -Purification solutions: Two solutions were used in this respect:
Table (1): Names of Sweet Sorghum (Ankolib) accessions, site of collection, glume and seed color.
No. | Name of Accession | Site | Glume color | Seed color |
1. | Black Ankolib | Sinnar | Black | Brown |
2. | B.W. Ankolib | Sinnar | Black & White | Brown & Creamy |
3. | D.R. Ankolib | Sinnar | Dark Red | Creamy |
4. | R.Y. Ankolib | Gadarif | Red & Yellow | Brown & Creamy |
5. | White Ankolib | Neyala | White | Creamy |
6. | W.B. Ankolib | Gadarif | White & Black | Brown & Creamy |
7. | Bengaga | Sinnar | Creamy | Orange |

Seed germination:
Seeds of each accession were germinated in pots in the lab and left to grow for a week.
DNA Extraction:
It is based on the hexa-decyltri-methylamonium bromide (CTAB) method to isolate DNA from tissues containing high levels of polysaccharides and secondary metabolites affecting DNA purification. This modified CTAB (2%) protocol includes the use of 1.4 M NaCL, (0.03%) β-mercaptoethanol, 50 µl sodium acetate and 1ml absolute ethanol for DNA extraction and purification as well as reducing the centrifugation times during the separation and precipitation of the DNA. The tubes were centrifuged at (10000 rpm for 15 min.) to precipitate DNA pellets. The solution in each tube was carefully poured off and the DNA pellets were washed again with (70%) ethanol and centrifuged at (10000 rpm for 2 min.) The solution was poured off and the pellets were air-dried. (200 µl) TE buffer or D.D.W. was added and the tubes were left at room temperature for (30 min.) to dissolve the DNA pellets and were then kept at (20˚C.) DNA purity was determined by a UV-VIS spectrophotometer at wave length of (260 nm). The purity was then calculated as the ratio of absorbance at (260 nm to 280 nm.).
Concentration of DNA:
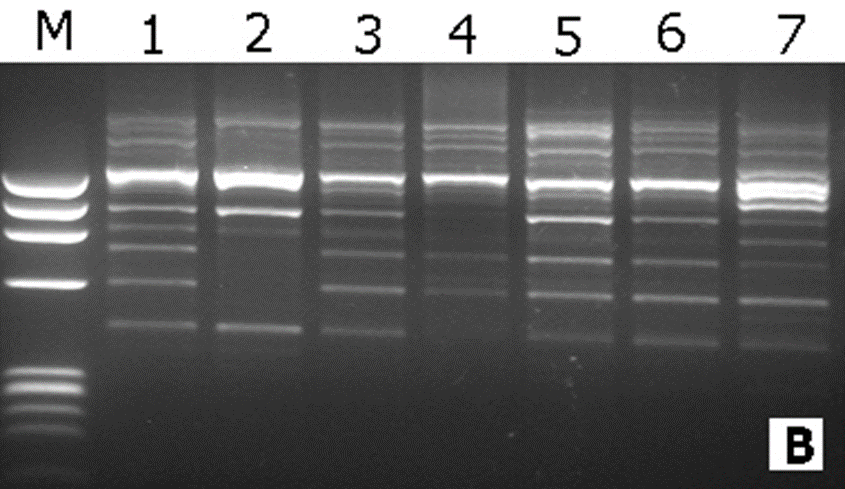
The DNA was diluted by 1:5 in D.D.W. the samples were electrophoresed in (1%) agarose gel against (0.1 ng.) of a DNA size marker (Lambda DNA digested with Hind III and PHIX 174 DNA digested with Hae III). This marker covers a range of DNA fragments size between (23130 bp. and 310 bp.), and a range of concentration between 95 ng. and 11 ng. ( Figure 5). The DNA concentration in a given sample was then estimated by comparing the degree of fluorescence of the unknown DNA band with the different bands in the DNA size marker.
DNA Purification:
Pure DNA was obtained according to the following procedure: 2 µl RNase were added to each eppendorf tube and the tubes were transferred to eppendorf thermomixer 5436 (37˚C) for (60 min.) 50 µl sodium acetate and 1 ml absolute ethanol were added to each tube and tubes were gently inverted and left for (10 min.) and left in refrigerater.
PCR Reaction
The PCR reaction comprises three steps: denaturation, annealing and extension. The procedure adopted with some modifications.
RAPD-PCR Technique
A program was set up and entered in the PCR apparatus to carry out the above-mentioned steps using RAPD primers for (40) cycles as follows: denaturation at (94˚C) for (5) min., annealing at (36˚C) to amplify DNA for (45 sec/cycle) and finally extension at (72˚C for 1.5 min.). Another cycle of extension was conducted at (72˚C) for (7 min.). Table (3).
Preparation of Samples forRAPD-PCR Reaction
The samples contained a master mix and of DNA. The Master Mix consisted of 2.5 µl 10 X Taq Buffer, 2.5 µl d NTPs (2.5 mm.), 2 µl MgCl2 (25 mm.), 2 µl Primer 10 pmol, 0.3 µl Taq DNA Polymerase (5U/µl) and 13.7 µl D.D.W. The 24 RAPD 10-mer primers used in this study were listed in table (2). 23 µl of the master mix were put in (0.2 ml.) eppendorf tube and 2 µl template DNA (10 ng) were added. The process was repeated 24 times for each DNA sample according to the primer's number. The tubes were transferred to PCR apparatus and the program was run. The RAPD-PCR products were stored in a refrigerator at (-20˚C).
Table (2): The Operon 10-mer random primers, code and sequence.
No. | Code | Sequence |
1 | OP-A01 | 5́ CAGGCCCTTC 3́ |
2 | OP-A02 | 5́ TGCCGAGCTG 3́ |
3 | OP-A07 | 5́ GTGACGTAGG 3́ |
4 | OP-A08 | 5́ GTGACGTAGG 3́ |
5 | OP-A09 | 5́ GGGTAACGCC 3́ |
6 | OP-A10 | 5́ GTGATCGCAC 3́ |
7 | OP-A12 | 5́ TCGGCGATAG 3́ |
8 | OP-A15 | 5́ TTCCGAACCC 3́ |
9 | OP-B02 | 5́ TGATCCCTGG 3́ |
10 | OP-B05 | 5́ TGCGCCCTTC 3́ |
11 | OP-B07 | 5́ GGTGACGCAG 3́ |
12 | OP-B12 | 5́ CCTTGACGCA 3́ |
13 | OP-B14 | 5́ TCCGCTCTGG 3́ |
14 | OP-B17 | 5́ AGGGAACGAG 3́ |
15 | OP-B18 | 5́ CCCACGCAGT 3́ |
16 | OP-B19 | 5́ ACCCCCGAAG 3́ |
17 | OP-C02 | 5́ GTGAGGCGTC 3́ |
18 | OP-C20 | 5́ ACTTCGCCAC 3́ |
19 | OP-G02 | 5́ GGCACTGAGG 3́ |
20 | OP-G03 | 5́ GAGCCCTCCA 3́ |
21 | OP-G04 | 5́ AGCGTGTCTG 3́ |
22 | OP-G05 | 5́ CTGAGACGGA 3́ |
23 | OP-G07 | 5́ GAACCTGCGG 3́ |
24 | OP-G09 | 5́ CTGACGTCAC 3́ |
SSR -PCR Technique
Two programs were adopted here:
Table (3). SSR Primers for PCR Amplifications.
Primer sequence (*F and **R) | Primer ID | Code |
F: TGCGAAGAAAGCAGTAGCAAA R: TGGAGGTAGAAGACGCACG | ZM-ADH2N | A |
F: CCTCTACTCGCCAGTCGC R: TTTGGTCAGATTTGAGCACG | ZM-GPCI | B |
F: GGATGATGGACGTGCAGTC R: CTGGTACTGGTAGAGTCCACCC | MZE-ZEINP | C |
F: GTTTGGTCTTGCTGAAAAATAAAA R: GCTGGAGGCCTACATTATTATCTC | P-bnlg198 | S2 |
F: CTTCCCTCTCCCCATCTCCTTTCCAA R: GCAACCTGTCCATTCTCACCAGAGGATT | P-bnlg615 | S11 |
* F: Forward sequence
* R: Reverse sequence
Electrophoresis:
Preparation of Running Buffer
This buffer was composed of (50 ml.) TBE 10X (pH 8.0) [108g Tris, (55 g.) Boric Acid and (7.44 g.) EDTA in 1 L D.W.] dissolved in (950 ml.) D.W. Preparation of agarose gel (1.5%)
(1.5) g. of agarose gel were added to (100 ml.) TBE running buffer in (250 ml.) conical flask. The flask was shaken to dissolve the agarose gel, heated in a microwave for about (2 min.) and left to cool down at room temperature. 3 µl ethedium bromide were added to the cold melted gel, gently shaken and then poured in a gel tray with comb to form the wells where The PCR products were loaded and run.
Preparation of acrylamide gel (8%)
The gel was prepared by mixing the following materials: 6.7 ml. acrylamide,15.7 ml D.W., 175 µl TBE 10X, 12.5 TEMED and (10%) APS.
Preparation of samples for running:
(5µl) simple dye (loading dye) were added to each PCR product. Two markers were used to detected polymorphism among PCR products. Lambda X174 RF Hae III marker was used for RAPD-PCR products to determine molecular weight of bands run in (1.5%) agarose (gel. 100bp).
The gels were examined under UV light and were then photographed using a Polaroid Camera and Gel Doc.
The banding patterns generated by Basic-PCR markers RAPD and SSRs were compared to determine the genetic relatedness of the 97) sweet sorghum (Ankolib) accessions. Clear and distinct amplification products were scored as (1) for presence and (0) for absence of bands. Bands of the same mobility were scored as identical. The Genetic Similarity Coefficient (GS) between any two genotypes was estimated according to Dice Coefficient as follows:
Dice formula: GSij = 2a / (2a+b+c)
Where GSij = the measure of genetic similarity between two individuals i and j.
a = the number of bands shared by i and j.
b = the number of bands present in i and absent in j.
c = the number of bands present in j and absent in i.
Unweighted Pair Group Method using Arithmetic Average (UPGMA) was used for cluster analysis according to. In this method each accession represents an independent cluster and that distance between clusters were estimated by the Dice Coefficient. However, once several accessions have been linked together, the distance between two clusters is calculated as the average distance between all pairs of accessions in the two different clusters. Fig. (8).

Polymorphism detected by SSR markers:
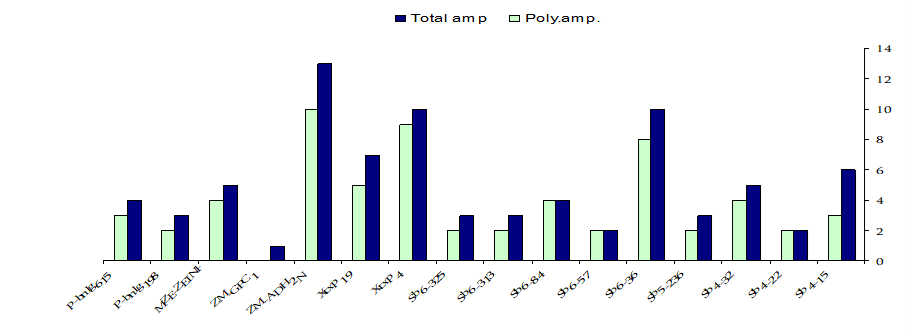
The sixteen SSR primer pairs used in this study had successfully generated a total number of 81bands. One pair (ZM-GPCI) generated only one monomorphic band. The total number of monomorphic fragments detected by the other (15) SSR primer pairs was (19) ranging from (1) to (3) bands per primer. The total number of polymorphic bands was (62) ranging from (2) to (10) fragments per primer. This represented a level of polymorphism of (76%) and an average of (3.9) fragments per primer. The size of the amplified fragment also varied with the type of primer and it ranged from (50 bp. to 1,100 bp.). Table (4).
Identification of accessions using unique markers
Unique markers are defined as bands that specifically identify an accession from another by their presence or absence. The bands that are present in one accession but not found in other accessions are termed positive unique markers (PUM), in contrast to the negative unique markers (NUM), which are absent in a specific genotype. These bands are useful for cultivar identification and fingerprinting.
Table (4). Primers sequence, the total number of amplicons (amp.), monomorphic amplicons, polymorphic amplicons and percentage of polymorphism as revealed by SSR analysis.
Primers | F: Forward and R: Reverse sequences | Total amp. | Mono. amp. | Poly. amp. | Poly.% |
Sb4-15 | F:GCTGCTAAGCCGTGCTGA R:TTATTTGGGTGAAGTAGAGGTGAACA | 6 | 3 | 3 | 50% |
Sb4-22 | F: TGAGCCGAAAACCGTGAG R: CCCAAAACCAAGAGGGAAGG | 2 | - | 2 | 100% |
Sb4-32 | F: CTCGGCGGTTAGCACAGTCAC R: GCCCATAGACAGACAGCAAAGCC | 5 | 1 | 4 | 80% |
Sb5-236 | F: GCCAAGAGAAACACAAACAA R: AGCAATGTATTTAGGCAACACA | 3 | 1 | 2 | 60% |
Sb6-36 | F: GCATAATGACGGCGTGCTC R: CTTCCAAGTGAAAGAAACCATCA | 10 | 2 | 8 | 80% |
Sb6-57 | F: ACAGGGCTTTAGGGAAATCG R: CCATCACCGTCGGCATCT | 2 | - | 2 | 100% |
Sb6-84 | F: CGCTCTCGGGATGAATGA R: TAACGGACCACTAACAAATGATT | 4 | - | 4 | 100% |
Sb6-313 | F: TTCTTCAGTTCGCACAGCATAA R: ACCTGCAGTGCACTTGACTATTG | 3 | 1 | 2 | 60% |
Sb6-325 | F: AGCGCAGGAGCGCGAA R:TCATCCGCTACTACCGTACCGTCAGAAA | 3 | 1 | 2 | 60% |
Xtxp4 | F: AATACTAGGTGTCAGGGCTGTG R: ATGTAACCGCAACAACCAAG | 10 | 1 | 9 | 90% |
Xtxp19 | F: CTTTAATCGGTTCCAGAC R: CTTCCACCTCCGTACTC | 7 | 2 | 5 | 71% |
ZM-ADH2N | F:TGCGAAGAAAGCAGTAGCAAA R: TGGAGGTAGAAGACGCACG | 13 | 3 | 10 | 76% |
ZM-GPCI | F: CCTCTACTCGCCAGTCGC R: TTTGGTCAGATTTGAGCACG | 1 | 1 | - | 0% |
MZE-ZEINP | F:GGATGATGGACGTGCAGTC R:CTGGTACTGGTAGAGTCCACCC | 5 | 1 | 4 | 80% |
P-bnlg198 | F: GTTTGGTCTTGCTGAAAAATAAAA R: GCTGGAGGCCTACATTATTATCTC | 3 | 1 | 2 | 60% |
P-bnlg615 | F: CTTCCCTCTCCCCATCTCCTTTCCAA R:GCAACCTGTCCATTCTCACCAGAGGATT | 4 | 1 | 3 | 75% |
| Total | 81 | 19 | 62 |
|
| Average | 5.1 | 1.2 | 3.9 | 76% |
Accessions identification by unique RAPD markers
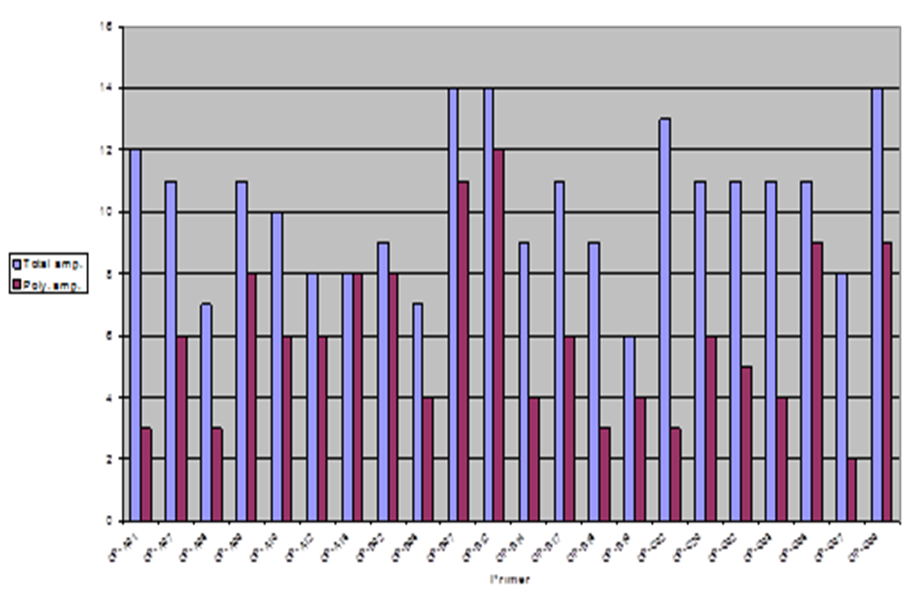
In this study, the RAPD technique was successful in characterizing all of the (7) tested (Ankolib) accessions by unique positive and/or negative markers. These markers ranged in size from (275 bp to 3,000 bp.). A total number of (67) unique markers were identified by the (22) RAPD primers used in this study. Out of the 22 primers, 3 primers (OP-A-15, OP-B-19 and OP-C-20) exhibited only one positive unique marker while 4 primers (OP-A-07, OP-B-05, OP-C-02 and OP-G-02) showed only one negative unique marker. The accession Bengaga showed the highest number (27) of the unique markers from which 14 were positive and 13 were negative. This number (27) was obtained from (14) different RAPD primers.
Genetic relationships among the (7) Sweet Sorghum Ankolib accessions as revealed by RAPD markers:
To examine the genetic relationships among the study samples based on RAPD results, the scored data were analyzed using the Dice Coefficient to compute the genetic similarity matrices. These similarity matrices were then used to generate a dendrogram using the UPGMA method. The estimated genetic similarity matrices among the accessions ranged from (73.7 to 89.5) thus revealing high levels of genetic similarity among the studied accessions. The highest genetic similarity percentage (90%) is between the accessions: Black Ankolib and Black White Ankolib followed by 89
From the above discussion it can be concluded that DNA-based markers are useful tools for identification, fingerprinting and assessment of genetic relationships of sweet sorghum. This study can be summarized as follows:
This molecular genetic identification study on sweet sorghum would provide basic molecular genetic data for its genetic engineering in Sudan. Sweet sorghum is a very high biomass yielding crop. It can be grown as grain crop, feed crop, sugar crop and energy crop for making ethanol and electricity. Using the ethanol as fuel instead of petrol, it will not only save petrol but also can decrease environmental pollution.