
Research Article | DOI: https://doi.org/10.58489/2836-5933/007
1 Department of Dental Basic Sciences, College of Dentistry, University of Duhok, Duhok, Iraq.
2 Department of Animal Production, College of Agriculture and Forestry, University of Mosul, Mosul, Iraq.
*Corresponding Author: Firas A. Mizory
Citation: Firas A. Mizory, Nidhal T. Altaee, (2023). Effects of adding Moringa oleifera seeds on the performance and production of common carp (Cyprinus carpio L.). Journal of Marine Science and Research. 2(1). DOI: 10.58489/2836-5933/007
Copyright: © 2023 Firas A. Mizory, this is an open access article distributed under the Creative Commons Attribution License, which permits unrestricted use, distribution, and reproduction in any medium, provided the original work is properly cited.
Received: 27 January 2023 | Accepted: 07 February 2023 | Published: 27 February 2023
Keywords: fish nourishment; accumulated information; protein; production; feed efficiency; and feed consumption.
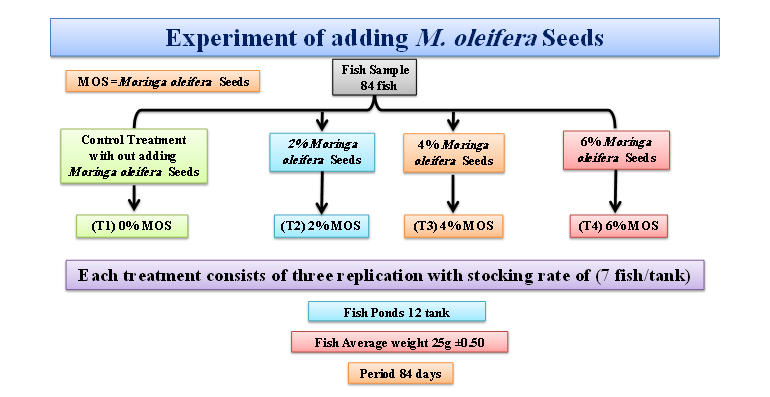
The objective of this study was to assess the effects of utilizing Moringa oleifera at various inclusion levels in fish meal-based diets for common carp fish. In this study, we employed seeds at various concentrations, such as 2% Moringa oleifera seeds (MOS) for T2, 4% MOS for T3, and 6% MOS for T4, in comparison to control treatment T1 without it (0% MOS). The treatment T4 substantially (P> 0.05) reached the highest specific growth rate, which was recorded at (0.781%), before dropping to records of (0.689%, 0.610%, and 0.229%) for treatments T3, T2, and the control group T1. Additionally, Treatment (T4) had the highest relative growth rate (13.25%), which then decreased to records of (11.21%, 9.567%, and 3.033%) for Treatments (T3), T2, and Control Treatment (T1), respectively. The treatment T4 reached the maximum value of the daily growth rate, which was recorded at (0.283%), before dropping to records of (0.238), (0.2203), and (0.063%) for the treatments T3, T2, and the control treatmentT1, respectively. Treatment (T4) had the highest reported value of the ultimate body weight, coming in at 49.44g. After then, it started to fall, and records of 45.49g for Treatments (T3), 42.43g for Treatments (T2), and 30.51g for Control Treatment were made (T1). The total recorded feed intake for treatment (T4) was 7.54g, which was the highest value. Following that, it began to decrease, and measurements of 7.07g for Treatments (T3), 6.77g for Treatments (T2), and 5.83g for Control Treatment were made (T1). The body gained weight to its highest ever recorded level of 92.74g as a result of treatment (T4). It then began to decline, with records of 78.43g for Treatments (T3), 66.96g for Treatments (T2), and 22.21g for Control Treatment (T1). Significantly, Treatment (T4) contributed to the feed conversion ratio increasing to 3.16%, the highest level ever recorded. After that, it started to go down, with records of 2.83% for Treatments (T3), 2.51% for Treatments (T2), and 0.92% for Control Treatment (T1). Contrarily, partly as a result of the Control Treatment, the Feed Efficiency Ratio improved to 1.09%, the highest level ever recorded (T1). After that, it began to decline, with records of 0.39 percent for Treatments (T2), 0.35 percent for Treatments (T3), and 0.32 percent for Treatment (T4). The effect of the treatment caused the Protein Efficiency Ratio to rise sharply to its highest recorded value of 0.81%. (T4). After then, it started to fall, with records for Treatments (T3) of 0.68 percent, Treatments (T2) of 0.59 percent, and Control Treatment of 0.19 percent (T1). The greatest level of Protein Productive Value was likewise attained by Treatment (T4), which was 3.65%; thereafter, Treatments (T3), T2, and Control Treatment (T1) each achieved records of 3.32%, 2.98%, and 3.33 %. The maximum Fat Efficiency Ratio was attained by Treatment (T3) (10.49%), but it thereafter dropped to records for Treatments (T4), (T2), and Control Treatment (T1) of 8.43%, 7.75%, and 1.70%, respectively. The aim of this study is for the purpose of providing healthy nutrition requirements for fish. It concludes that T4 treatment which contains 6% moringa seeds was the best ratio to obtain best growth performance for common carp.
Aquaculture, which provided around 47% of the world's edible fish in 2014, is the fastest-growing, nutrient-producing, and food-delivery sector on Earth (FAO, 2016). Fishmeal (FM), a genuine component of fish feed, used to be the only source of nutrition for aquatic animals (Shahzad et al., 2022).
The common carp (Cyprinus carpio), which Linnaeus originally identified in 1758, is a resilient fish with a rapid growth rate that can endure adverse conditions. It belongs to the Cyprinidae family and order, which combined contain 7 sub families, 220 genera, and almost 20,000 known species (Yaqoob, 2021). After the carp Carassius carassius, the common carp is the second most frequent fish in Duhok City, according to Mizory, (2021). It is not advised to stock common carp ponds with more than two fish per square meter since, according to Mizory et al., (2020) stocking density has a substantial impact on common carp behaviour. Due to high concentrations, common carp began to eat for longer periods of time. Fish, on the other hand, grow more hostile when they are crowded.
The greatest sources of optional plant-derived protein for fish feed are plant-derived products (Hussain et al., 2019; Shahzad et al., 2020). Instead of utilizing fish, several studies recommended adopting a variety of plant-based sources of protein (Hussain et al., 2019). Because of their consistency, affordability, lack of phosphorus, high protein content, and diverse amino acid profile, plant protein sources are preferable for fish (Shahzad et al., 2022).
M. oleifera seeds and leaves are nowadays the parts of the plant that are most commonly used in food fortification due to their supposed nutritional content and lack of anti-nutrient compounds (Trigo et al., 2020).
The information will aid in supplying fresh perspectives and references for upcoming aquaculture production and research topics (Abdel-Latif et al., 2022). In the flowering plant family Moringaceae, there is just one genus, Moringa. The Moringa oleifera plant's family name is where the word "murunggai," or "muringa" in Malayalam, originates (Aiylari and Adeyeye, 2022).
Aquatic species are shielded against a variety of illness issues by the usage of medicinal herbs like moringa as nutritional supplements due to their antioxidant content. And raises the chance of survival while also enhancing growth performance, feed digestion, blood reading accuracy, and immunological response in common carp fingerlings (Abdallah et al., 2022).
In comparison to MO leaves and pods, the MO seed composition has greater levels of protein (36%), fat (38.7%), vitamin E (752 mg per 100 g of dry seed), magnesium (635 mg per 100 g of dry seed, and copper (5.2 mg per 100 g of dry seed) (Gopalakrishnan et al., 2016; Gautier et al., 2022). According to the findings of Manju et al., (2022) study, Moringa oleifera seed is an excellent source of fat, protein, and crucial minerals. Because of its nutritional potential, it can be used to formulate and fortify animal meals. The aim of this study is determined the effect of adding dietary moringa on growth performance and food utilization of carp.
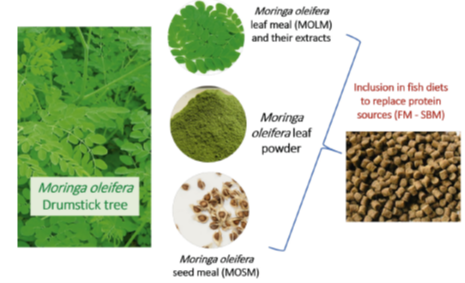
M. oleifera seed meal (MOSM)
A long time ago, moringa was used as a feed additive. The feeding of Moringa seeds was first recorded in 1962 (Ranachandran et al., 1980). Following oil extraction, farm animals have been given leaves (both fresh and dried), young branches, and seed fragments (Wu et al., 2013). Moringa leaves have been used a lot as substitutes for traditional protein meals in recent years for monogastric animals (like pigs, rabbits, and chickens), ruminants (like cattle and sheep), and aquatic species (Wu et al., 2013; Ferreira et al., 2019; Mahfuz and Piao, 2019; Su & Chen, 2020). Commercially known as "ben oil" or "behen oil," seed oil resembles olive oil in look and smell and has a nutty flavor (Dhakad et al., 2019). The seeds include around 35% of rose yellow essential oil, 31.65% of protein, 8.90% of moisture, 7.54% of fiber, and 6.53% of ash material (Mahmood et al., 2010). M. oleifera seeds have a seed oil yield of 40.98%, which is somewhat lower than that of M. peregrina seeds (49.23%), according to Al-Juhaimi et al., (2017). Oleic acid accounted for 64.56% of this, followed by behenic acid in second place with 6.98%, elaidic acid in third place with 6.39%, vaccenic acid in fourth place with 6.0%, and palmitic acid in fifth place with 5.98%. Moreover, arachidic acid came in at 4.40%. M. oleifera seed oil did not contain any cholesterol. They said that compared to leaves, seeds had higher concentrations of essential amino acids and crude protein (Dhakad et al., 2019).
Methionine, cystine, and tryptophan are essential amino acids found in M. oleifera seed meal (MOSM), which also has important vitamins and a significant quantity of protein (33–38%). (Shahzad et al., 2022). M. oleifera seed may be an excellent source of protein, lipids, and other nutrients. However, MOSM contains phytate, sometimes referred to as phytic acid, an antinutritional chemical (Worku, 2016). When consuming phytate as part of a plant-based diet, fish's capacity to absorb nutrients may be harmed (Hussain et al., 2015). Additionally, it can form bonds with critical amino acids in a variety of fish species, lowering the bioavailability of nutrients, notably protein (Usmani and Jafri, 2002; Shahzad et al., 2022). Angiosperm plant Moringa oleifera, sometimes known as the drumstick tree, demonstrates a range of advantageous effects based on the plant's origin and part. Different portions of this plant have been used historically for its medicinal and feeding effects (Mbikay, 2012; Leone et al., 2015; Shourbela et al., 2020). The seeds could, for instance, act as a pathogen-repelling antimicrobial agent. They include certain coagulation-related proteins, making them beneficial for purifying water as well (Nikkon et al., 2003; Suarez et al., 2003). The Nile tilapia, Oreochromis niloticus, as well as other fish species' development, immune systems, and antioxidant activity have all been shown to be impacted.
Critical amino acids including methionine, cystine, and tryptophan as well as important vitamins and a significant quantity of protein (33–38%) are all present in M. oleifera seed meal (MOSM) (Shahzad et al., 2022). M. oleifera seed has a good amount of fat, protein, and other nutrients. However, MOSM contains the antinutritional chemical phytate, sometimes referred to as phytic acid (Worku, 2016). When phytate is ingested as part of a plant-based diet, fish's capacity to absorb nutrients may decline (Hussain et al., 2015). Additionally, it may form bonds with crucial amino acids in a variety of fish species, which decreases the bioavailability of nutrients, especially protein (Usmani and Jafri, 2002; Shahzad et al., 2022).
Study site and feeding trials
The study was conducted at the Ichthyology Laboratory at the Department of Animal Production in the College of Agricultural Engineering Sciences at the University of Duhok (UoD), Summel Campus, Duhok, Kurdistan Region, Iraq . With an average body weight of 20 to 30 g, there were 100 common carp fish in total. The research was carried out from August to November 2021. In 12 plastic fish tanks, each measuring tanks 60.96 cm x 55.88 cm x 40.64 cm there were 4 treatments (3 replicates per treatment). To maintain the quality of the water, water was also changed every day at a rate of 30%. Fish were given twice daily meals at 6:30–8:30 and 14:30–15:30 h at a rate of 3% of body weight for 84 days. Throughout the trial, fish were weighed every two weeks to assess their growth performance.
Fish feed formulation:
Four separate experimental meals with between 27-29% crude proteins content were produced using various levels of M. oleifera meal inclusion together with other nutrients from soybean meal, fish meal, wheat, sunflower meal, and premix (Table 1). Tables 2 list the fish that were fed these diets as T1, T2, T3, and T4, with (MOS) added to each diet in quantities of 0% (control), 2%, 4%, and 6%. For common carp fish farming in Duhok, where it achieved the best development and feed utilization, the lowered growth may be regained by raising the dietary protein content (Mizory and Selivany, 2012).
Parameters | % |
Moisture | 8.04 ± 0.01 |
Ether extract | 8.98 ± 0.07 |
Ash | 10.06± 0.01 |
Protein | 23.73 ± 0.05 |
Carbohydrate | 44.54 ± 0.03 |
Crude fiber | 4.65± 0.01 |
ME value | 3163.7±0.01 Kcal/Kg |
Table (1): The proximate composition (%) of dried M. oleifera seeds, Source (Kumar and Chauhan, 2022)
Ingredients | T1 | T2 | T3 | T4 |
Fish meal | 15 % | 15 % | 15 % | 15 % |
Corn | 13 % | 13 % | 13 % | 13 % |
Soybean meal | 30 % | 30 % | 30 % | 30 % |
Barley | 17 % | 17 % | 17 % | 17 % |
Wheat | 23 % | 23 % | 23 % | 23 % |
Premix | 2 % | 2 % | 2 % | 2 % |
M. oleifera Seeds | 0% | 2% | 4% | 6% |
Table (2): Composition (%) of control and MOS diets experimental diets provided to carp, (NRC, 1993; Jobling, 2011).
Seed | Moisture % | Protein % | Ether Extract% | Ash % | NFE % | ME MJ/Kg |
T1 0% | 7.05d ±0.012 | 27.77d ±0.123 | 3.131a ±0.021 | 3.3d ±0.011 | 58.75 | 1437.701 |
T2 2% | 10.27a ±0.035 | 28.65c ±0.242 | 2.195c ±0.018 | 6.5c ±0.023 | 52.39 | 1335.066 |
T3 4% | 7.61c ±0.026 | 29b ±0.198 | 1.905d ±0.016 | 8b ±0.042 | 53.49 | 1347.111 |
T4 6% | 7.67b ±0.029 | 29.35a ±0.268 | 2.821b ±0.00024 | 8.5a ±0.038 | 51.66 | 1359.178 |
Table (3): Chemical diet composition by different levels of M. oleifera Seeds
As a result of the low moisture level of the Moringa samples used in this experiment, which was 7.05%, 10.27%, 7.61% and 7.67% for T1, T2, T3 and T4 respectively; it is believed that the activity of the microorganisms would be lowered, prolonged the storability of the Moringa seed meal; this observation is in agreement with the report of Manju et al., (2018) study who refer that the same point. Also, Abdel-Latif et al., (2022) refer that M. oleifera would put on more weight and show better growth performance, biometric, and feed utilization indices. Along with significant hepatoprotective effectiveness, there were no negative impacts on the nearby carcass composition or haemato-biochemical parameters.
Chemical analysis of the diets and the eaten part of the fish, growth performance, feed utilization and body indices
Nutrient Ingredients: The main chemical components were estimated in the central laboratory at the College of Agricultural Engineering Science at Duhok University based on the standard methods that (Aiylari and Adeyeye, 2022). Explained as the followings:
Nutrient Ingredients: The main chemical components were estimated in the central laboratory at the College of Agricultural Engineering Science at Duhok University based on the standard methods that (Aiyelari & Adeyeye, 2022) explained as the followings:
Growth performance:
Feed Utilization:
Numerous research have focused on the use of moringa powder in fish feeding as a vegetarian protein source and as a feed supplement with the aim of promoting growth and raising production standards. Here, the growth results of common carp fed diets with various MOS levels (0, 2, 4, or 6%) are shown.
For the bulk of the growth parameters that were examined, group treatment number T4 (6% moringa seeds) produced the best results. Their means are clearly greater when compared to those of the other experimental groups. This study concerns Al-Rawashi, (2022) at another study in Al-Muthanna Province Southern Iraq using the same type of carp fish, in comparison to T3, T2, and control treatment T1.
Its inclusion of growth inhibitors, including as tannin, saponin, and vanic acid, which are discovered by the usage and addition of high levels of moringa to fish diets through its detrimental effects on metabolic processes within the digestive canal, may be the cause of such rise. Such as the presence of phytic acid, which has a negative impact on the digestive enzymes and inhibits their function through its association with them, as well as the formation of complexes of protein, phosphorous, and some mineral elements such as iron, magnesium, and calcium, which results in a decrease in the utilization of protein and important nutrients in the feed containing them by reducing their availability. This, by lowering their availability and absorption in the alimentary canal, results in a reduction in the utilization of protein and other nutrients in the diet containing them. then limit weight gain and growth (Dzuvoret al., 2022; Rawashi, 2022).
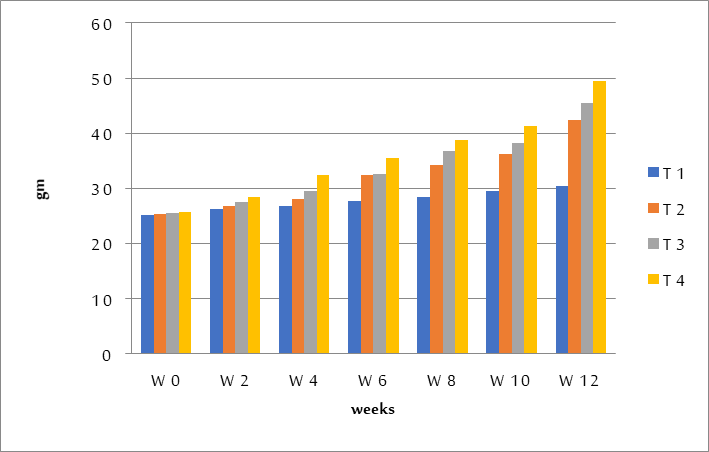
The results indicated that the highest amount of body weight growth was recorded for Treatment (T4), which included adding 6% moringa seed, attained (23.8g), and that it subsequently dropped to records (20g, 17g, and 5.334g) for Treatments (T3), Treatments (T2), and the Control Group (T1) figure (2).
The critical growth parameters specific growth rate, relative growth rate, daily growth rate, final body weight, total feed intake, and body Weight Gain are modified in Table 4.
The treatment T4 significantly (P> 0.05) attained the highest specific growth rate, which was recorded at (0.781%), before declining to records of (0.689%, 0.610%, and 0.229%) for treatments T3, T2, and the control group T1. Additionally, Treatment (T4) obtained the maximum level of relative growth rate (13.25%), after which it declined to records (11.21%, 9.567%, and 3.033%) for Treatments (T3), T2, and Control Treatment (T1), accordingly. The treatment T4 attained the highest value of the daily growth rate, which was recorded at (0.283%), before declining to records of (0.238), (0.2203), and (0.063%) for the treatments T3, T2, and the control treatmentT1, respectively.
The highest recorded value of the final body weight belonged to Treatment (T4), which reached 49.44g. It then declined to records of 45.49g for Treatments (T3), 42.43g for Treatments (T2), and 30.51g for Control Treatment (T1). Treatment (T4) had the highest reported value of the total feed intake, which was 7.54g. After then, it started to fall, and records of 7.07g for Treatments (T3), 6.77g for Treatments (T2), and 5.83g for Control Treatment were made (T1). Treatment (T4) was responsible for the body's weight gain reaching its highest recorded figure of 92.74g. After that, it started to fall, with records of 78.43g for Treatments (T3), 66.96g for Treatments (T2), and 22.21g for Control Treatment (T1).
Table (4): Effect of M. oleifera seeds diets as feed supplements in common carp Cyprinus carpio L. growth traits.
| Treatments | T1 | T2 | T3 | T4 |
| Weight gain | 5.34±0.12d | 17±0.08c | 20±0.16b | 23.8±0.21a |
| Specific growth rate | 0.229±0.011d | 0.610±0.032c | 0.689±0.018b | 0.781±0.021a |
| Relative growth rate | 3.033±0.45d | 9.567±0.27c | 11.21±0.26b | 13.25±0.75a |
| Daily growth rate | 0.0636±0.005d | 0.203±0.007c | 0.238±0.006b | 0.283±0.008a |
| Final body weight | 30.51±0.18d | 42.43±0.27c | 45.49±0.35b | 49.44±0.42a |
| Total feed intake | 5.83±0.014d | 6.77±0.012c | 7.07±0.018b | 7.54±0.016a |
| Body weight gain | 21.22±0.44d | 66.96±0.42c | 78.43±0.66b | 92.74±0.48a |
Means within different letters within grouping differ significantly, WG=weight gain, SGR; specific growth rate, RGR; relative growth rate, DGR; Daily weight gain, FBW; final body weight, TFI; total food intake and TWG; total weight gain.
Table (5): Effect of different ratios administered in common carp Cyprinus carpio L. on feed utilization.
| Treatments | T1 | T2 | T3 | T4 |
| Feed conversion ratio | 0.92±0.023d | 2.51±0.011c | 2.83±0.033b | 3.16±0.025a |
| Feed efficiency ratio | 1.09±0.014a | 0.39±0.06b | 0.35±0.04c | 0.32±0.009d |
| Protein efficiency ratio | 0.19±0.005d | 0.59±0.004c | 0.68±0.006b | 0.81±0.008a |
| Protein productive value | 1.33±0.018d | 2.98±0.026c | 3.32±0.019b | 3.65±0.024a |
| Fat efficiency ratio | 1.70±0.009d | 7.75±0.12c | 10.49±0.08a | 8.43±0.05b |
Means within different letters within grouping differ significantly, FCR; feed conversion ratio, FER; feed efficiency ratio, PER; protein efficiency ratio, PPV; protein productive value and fat ER; fat efficiency ratio.
Additional growth indicators were provided in table 5 as follows: feed conversion ratio, feed efficiency ratio, protein efficiency ratio, protein productive value, and fat efficiency ratio.
Significantly Treatment (T4) was in part to blame for the feed conversion ratio rising to 3.16%, the highest level ever observed. Following that, it began to decline, with records of 2.83% for Treatments (T3), 2.51% for Treatments (T2), and 0.92% for Control Treatment (T1). The Feed efficiency ratio, on the other hand, increased to 1.09%, the highest level ever recorded, in part due to Control Treatment (T1). After that, it started to go down, with records of 0.39 percent for Treatments (T2), 0.35 percent for Treatments (T3), and 0.32 percent for Treatment (T4).
The Protein Efficiency Ratio dramatically increased to its highest recorded value of 0.81% under the influence of Treatment (T4). After that, it began to decline, with records of 0.68 percent for Treatments (T3), 0.59 percent for Treatments (T2), and 0.19 percent for Control Treatment (T1). Treatment (T4) also achieved the highest level of Protein Productive Value (3.65%), which then decreased to records (3.32%, 2.98%, and 3.33%) for Treatments (T3), T2, and Control Treatment (T1), respectively. While Treatment (T3) achieved the highest Fat Efficiency Ratio (10.49%), it thereafter decreased to records for Treatments T4, T2, and Control Treatment (T1) of 8.43%, 7.75%, and 1.70%, respectively.
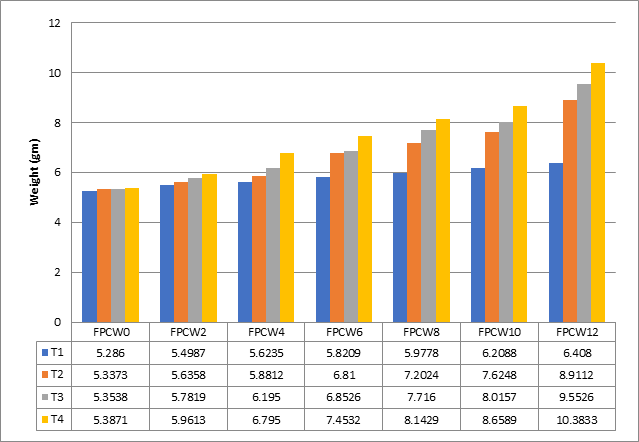
Figure 3 shows that T4 feeding group, which uses 6% MOS, has the greatest amount of Feed provided cumulatively (10.38g), compared to the T3, T2, and T1 groups, which had respective levels of (9.55, 8.91, and 6.41g).
When compared to the fish given the diets containing 30, 40, and 50% M. oleifera leaf meal, there was a significant difference in the feed conversion ratio (P> 0.05), while there was no difference in the fish fed the control diet, 10 and 20% M. oleifera leaf meal diet Dienye and Olumuji, (2014). Furthermore, Abdel-Latif et al., (2022) indicate that several studies have investigated the effectiveness of various M. oleifera forms in aqua feeds (Fig. 2). While Mizory and Altaee (2023a) demonstrate in their study that the optimal percentage for carp fish growth was 4% of the leaves of the moringa tree. Additionally, Mizory and Altaee (2023b) demonstrate in their study that the addition of 4% of moringa leaves to the diet as a supplement was the most effective in promoting carp fish development when compared to the control treatments of 0% moringa, 2% moringa, 4% moringa, and 6% moringa.
In the figure (2) the results deals with Rawashi, (2022) at another study in Al-Muthanna Province, Southern Iraq by using the same type of fish. The findings in figure (3) in terms of final daily growth rate (DGR), weight gain rate (WGR), specific growth rate (SGR) and feed efficiency (FE), all of which were considerably higher (P <0>
Diets containing 30, 40, and 50% M. oleifera leaf meal, there was a significant difference in the feed conversion ratio (P> 0.05). With some slight differences, moringa seeds contain substantial concentrations of lipids and proteins. Palmitic, stearic, arachidic, and benic acids make up the majority of the saturated fatty acids in the seeds (Manju et al., 2018).
Furthermore, Abdel-Latif et al., (2022) indicate that several studies have investigated the effectiveness of various M. oleifera forms in aqua feeds (Fig. 2), including M. oleifera leaf meal (MOLM) and its aqueous, methanolic, and ethanolic extracts, M. oleifera leaf powder, and M. oleifera seed meal (MOSM). In a related research for Moringa seed meal, Adeshina et al., (2018) found that supplemented meals can enhance Cyprinus carpio juvenile growth.
In contrast to Mizory and Altaee (2023a) study, which discovered that the best growth percent was achieved, using leaves, the experiment using moringa seeds at various levels revealed that the best growth percent for carp fish was achieved, using seeds. This result may be due to the different chemical composition of the two types of moringa.
Significant enhancements to the Final body weight, WG, SGR, PER, and FCR of common carp Moringa seed meal also significantly improves the immune response of fish. According to the authors' claims, M. oliefera seed meal might potentially replace 30% of the soybean in the diets of young carp Su and Chen (2020). Common carp grow at varying rates based on the local climate, food availability, and population density. No such exhaustive examination of the scientific and social elements of this foreign species has been carried out under these agro-climatic circumstances since its introduction, with the exception of minor publications on food and feeding, age, and fecundity (Yaqoob, 2021).
Mizory and Altaee (2023b) conclude from the foregoing that the addition of moringa seeds in proportions of 2, 4 and 6 to the diet of common carp fish enhanced both the growth parameters and some other parameters of the experimental fish. But the bester level in their study was 4%.
From this study, it can be concluded that;