
Research Article | DOI: https://doi.org/10.58489/2833-0943/022
*Corresponding Author: Adebisi Fagbohun
Citation: A. Fagbohun, M.S. Dauda, T.S. Anjorin, (2024), Assessing the Profile of Glyphosate Residues in Maize Grains Sold in the Federal Capital Territory Abuja, Nigeria. Pesticide Science and Pest Control. 3(1). DOI: 10.58489/2833-0943/022
Copyright: © 2024 Adebisi Fagbohun, this is an open-access article distributed under the Creative Commons Attribution License, which permits unrestricted use, distribution, and reproduction in any medium, provided the original work is properly cited
Received: 09 August 2023 | Accepted: 01 March 2024 | Published: 12 March 2024
Keywords: Maize grains, Contamination, Residue, Herbicide, Health hazard, Human exposure, Nigeria.
Abstract
The profile of glyphosate residues in maize grains sold in the Federal Capital Territory Abuja (FCT), Nigeria was assessed.
Methods
Twenty-six maize grains samples of yellow and white morphotypes were collected from some selected markets within the FCT, Abuja. Analytical methods on the pulverized maize grains included solvent extraction using (acetonitrile/water (55:45), clean-up of pesticide residues and their quantification by HPLC/UV as described by AOAC - QuEChERS method.
Results
The results showed that the mean concentration of glyphosate in the maize grains ranged from 0 to 24.30 ± 0.002 mgkg_1 with a mean glyphosate concentration of 3.474 mgkg-1 was detected. Four samples representing 17.86% of the samples collected violated WHO/FAO CODEX standard of 5.0 mgkg-1 while values recorded for Acceptable Daily Intake (ADI) for all the samples were within an acceptable limit of 0 - 1 mgkg-1. Heath risk index values were <1 suggesting that the consumer populations were not at risk.
Conclusion
The high profile of glyphosate residue in maize grains from Gwagwalada Area Council of the FCT is of great concern and needed to be further investigated
HIGHLIGHTS
The Health Index (HI) for all the maize grains was ˂ 1 and signified no associated risk
Maize grains are one of the major staples produced in North Central Nigeria where the Federal Capital Territory (FCT) is located. The use of herbicides is highly merited to improve crop yield and quality by reducing or inhibiting the growth of weeds. Herbicide plays a fundamental role in reducing crop yield losses and stabilizing the supply of crop produce all year round (Salazar and Rand, 2020; Larsen et al., 2021). Among several herbicides formulations, glyphosate-based herbicides (GBHs) are globally famous and widely used for the management of perennial weeds such as Crowfoot grass (Dactyloctenium aegyptium) Wire grass (Sporobolus diander) and Sacciolepsis africana), as well as by acting as a harvesting aid accelerating crop dry down (Upasani and Baria, 2019; Anjorin et al., 2020).
Glyphosate (N- phosphonomethyl glycine) is an organophosphorous-based herbicide applied to combat a wide range of unwanted weeds (Kalofiri et al., 2021). Nowadays, there are hundreds of GBHs commercialized under different brands in more than 100 countries across the world (Silva, et al., 2018; Antier et al, 2020). Currently, glyphosate is the most used herbicide worldwide (Nerozzi et al., 2020; Benbrook et al., 2016). Glyphosate (GLY) is one of the most commonly used herbicides in the world. Its usage has significantly increased after the introduction of genetically modified glyphosate-tolerant crops such as corn, soybeans, and cotton. GLY is marketed in different formulations, such as Roundup® by Monsanto, Touchdown® and Touchdown forte HiTech® by Syngenta. Roundup® (hereafter referred to as glyphosate-RP) contains 460 g a.i./L isopropylamine salt of glyphosate, Touchdown® (hereafter referred to as glyphosate-TD) contains 480 g a.i./L diammonium salt of glyphosate, and Touchdown forte HiTech® (hereafter referred to as glyphosate-TF) contains 500 g/L potassium salt of glyphosate. Glyphosate-TF is a new and improved formulation, recently introduced for testing in West Africa, with an innovative system for enhancing weed control through quick uptake and distribution in the plant (David et al., 2010; Vera et al., 2010; Nerozzi et al.,2020).
Currently, more than 1.4 billion pounds of glyphosate are applied to fields per year (Beckie et al., 2020). US Environmental Protection Agency (EPA) regulations set the tolerance levels for the occurrence of glyphosate in food commodities and produce (GPO, 2014; Reynoso et al., 2019). Glyphosate is applied intensively in crop fields, and its residues are frequently detected in the environment, particularly in plants, soil, water, food products and also in human urine (Benbrook et al., 2016; Shaw, 2021). Consequently, concerns increased within the scientific community about the potential impact GLY herbicide and its metabolites on the ecosystem and humans. (Vera et al., 2010; John et al., 2016). The exponential rise in glyphosate use over the years also brought an increased concern about its possible toxicity and the eventual consequences to human health. Hence, the commercialization of GBHs is highly regulated, and there are maximum residue limits (MRLs) established for glyphosate residues in foods (Antier et al., 2020; et al., 2021).
Herbicides such as glyphosate are known to have high efficiency in killing weeds, and its inexpensive and wide range of activities among others make them farmers’ preferable choice (Rathod and Garg, 2017). However, the toxic compounds in this herbicide have adverse effects on the environment and human health (Davoren and Schiestl, 2018, Rani et al., 2021). For instance, GLY has been reported to destroy the mammalian immune system (Peilex and Pelletier, 2020; Ojelade et al., 2022) and reproductive system (Jarrel et al., 2020).
Glyphosate residue poisoning can lead to lung failure, unconsciousness, paralysis, suffocation and seizures. Intermediary exposure to glyphosate leads to vomiting, diarrhea, weakness, impaired vision and neuromuscular symptoms like muscle spasms. Furthermore, increased saliva, sweating, eye-watering and nausea are the result of short-term exposure to glyphosate. (Hussain and Siddique, 2010, Richmond, 2018).
The presence of glyphosate residue above MRLs in maize grains might pose a serious threat to humans health due to major safety concerns in terms of crop produce and food contamination. To provide safe food and ensure food security, there is a need to determine the hazardous compound in food sources (Beyer and Biziuk, 2008; Van et al., 2018; Kolakowski et al., 2020; Soares, et al.,2021). Quantification of herbicide residues in crop produce and retailed food is one way of determining the level of risk and potential health hazards to humans due to exposure to these chemicals. This study aimed at assessing the level of GLY residue in maize grains sold in Abuja, Nigeria and also its human risk assessment in the study area.
The study location
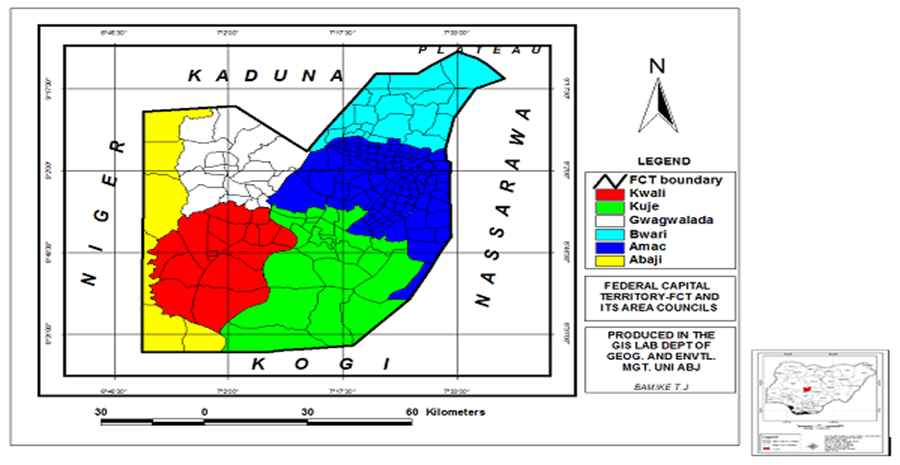
The area of study is the FCT which is the administrative capital of Nigeria and situated in the geographical heartland of the country. It has a land area of 8,000 square kilometers and lies between Lat. 8.25° N and 9.21° N and Long. 6.45° E and 7.39° E and with an estimated population of 1.8 million It has a total area of 713 km2 (NBS, 2020). The territory’s borders are Kaduna State to the North, Kogi State to the South, Nasarawa State to the East, and Niger State to the West (Figure 1). FCT is one of Nigerian leading urbanized centers. Due to its centrality, the FCT is well-connected and accessible from the States and Federal highways. Abuja has savannah vegetation, giving it rich soil for agriculture and a favorable climate that is pleasant year-round and is neither overly hot nor under-cold. The FCT is divided into six area councils; Kuje, Abaji, Bwari, Gwagwalada, Kwali, and Municipal Area Council (AMAC).
Sampling method
The samples were collected from some selected markets located within the six area councils of the FCT. A total of 130 dried maize grains samples were collected at random from retail markets located within the FCT, Abuja, Nigeria (Table 1). In each market, 5 composite samples of maize grains were collected and bulked together giving a total of 26 samples. The collected samples were labeled, placed into sterile polystyrene bags, and immediately transported under complete aseptic conditions in ziplock bags to Chemistry Advanced Research Centre, Sheda Science and Technology Complex Abuja and kept in a -20oC refrigerator pending analytical determination.
Chemicals and materials
In this study, the chemicals used were GLY standard, formic acid concentration, acetonenitrile, acetone, Methanol, all solvents are 99.90% HPLC grade and purchased from Sigma-Aldrich USA. Besides, Sodium sulphate (Na₂SO4), Magnesium sulphate anhydrous fine powder (MgSO4), graphitized carbon black (GCB), primary secondary amine (PSA), disodium hydrogen citrate sesquihydrate (C6H6Na2O71.5H2O), trisodium citrate dehydrate (C6H2Na3O7.2H2O), sodium chloride (NaCl) to remove the remaining water in the solvent), Solid phase extraction tubes (SPE tubes), ceramic discs, purchased from Bioccomma Limited Hong Kong.
Table 1: Samples of maize grains collected from markets in the six areas councils of the FCT, Abuja
| S/N | Area Council | Location/Market | Grain’s code |
| 1 | Abaji | Abaji | AYM*, AWM |
| 2 | Kwali
| Kwali | KYM, KWM |
| Sheda | SYM, SWM | ||
| 3 | Gwagwalada
| Gwagwalada | GWM, GYM |
| Store Opposite teaching hospital | THSW, THYM | ||
| 4 | Bwari | Bwari | BWM, BYM |
| 5 | Abuja Municipal
| Lugbe Babangida | LYM, LWM |
| Karmu | KYM, KWM | ||
| Kado, fish | KFMYM, KFMWM | ||
| Utako | UWM, UYM | ||
| Garki village | G’WM, G’YM | ||
| Nyanya | NWM, NYM | ||
| 6 | Kuje | Kuje | KWM, KYM |
| Total number of samples collected | 26 | ||
*YM= Yellow maize grains, WM*= white maize grains
Sample Preparation
Foreign matters such as stone and admixtures were sorted out. And the samples were later pulverized with a laboratory blender (MasterChef) and then extracted and analyzed for the presence of glyphosate residue in maize samples.
Sample preparation procedure
A modified QuEChERS method was used for the preparation of sample extracts (Abhilash et al., 2009; AOAC Official method, 2007-01; Payá et al., 2007). Ten grams of finely ground sub-sample was placed in a polypropylene centrifuge tube (50 mL) and 10mL water was added. Followed by the addition of 15mL acetonitrile and the mixture vortex vigorously for 5 min. Further, 0.5 g disodium hydrogencitrate sesquehydrate, 1g trisodium citrate dihydrate, 4 g anhydrous magnesium sulphate, and 1 g sodium chloride were added, and the mixture was immediately vortex for another five minutes, then centrifuged at 4500rpm for 5 min. At this stage, an optional low-temperature clean step was performed before dispersive-SPE for the most complex matrices such as maize. For this, an aliquot of the supernatant was transferred into a glass test tube and stored for at least 2 h in a freezer (−20◦C). The extract was then separated from the precipitates by simple decantation. An aliquot of the extract was transferred into a polypropylene centrifuge tube containing 100mg anhydrous magnesium sulphate, 75mg C18, and 20mg PSA per mL acetonitrile extract. The tube was vortexed for 0.5 min and centrifuged at 4500rpm for 2 min. An aliquot of the supernatant was transferred into a glass test tube and acidified by adding 15µL of 5% (v/v) formic acid in acetonitrile per mL of extract.
Preparation of glyphosate standard solutions
Individual stock solutions containing 1000mg L-1 were prepared by accurately weighing 10mg of GLY standard in 5 ml beaker and dissolved in 5 ml acetonitrile and later transferred quantitatively into 10 ml standard volumetric flask and makeup to the mark with acetonitrile to prepare 1000ppm. An intermediate standard solution containing 200 mg L-1 of glyphosate standard was also prepared from the stock solutions by diluting with acetonitrile using the dilution formula. Working standard solutions (ranging from 5 - 40mg/ml) were prepared from the intermediate standard solution by diluting with deionized water and then used for the optimization of the parameters affecting the QuEChERS-DLLME procedure as well method validation. All solutions were stored under refrigeration below -4οC pending analysis (Halim, et al., 2013).
Instruments and equipment
Chromatographic analyses were performed using CECIL 3500 High-Performance Liquid Chromatography (HPLC) equipped with a binary pump, and UV-visible wavelength detector (VWD) all purchased from CECIL, England. Chromatographic separation was carried out using Eclipse plus C18 column (150 x 4.6 mm I.D., 3.5 µM particle sizes) obtained from CECIL CECIL Technologies. Data acquisition and processing were accomplished with Chemstation software Adept CECIL Technologies. The d-SPE tubes, supel QuE PSA (EN) tubes, containing 150 mg superclean PSA, 150 mg. Discovery dsc-18 and 900 mg MGSO4, used for sample clean-up in QuEChERS extraction procedure were purchased from Bioccomma Limited (Hong Kong). The centrifuge used is (England) and vortex mixer scientific industries (USA).
Analytical Method Validations
Linearity of the Standard Curves
A calibration curve has been produced for quantification. Linearity has been observed all along the area of concentration studied. These ranges of concentrations were selected in function of the sensitivity of the HPLC towards GLY herbicide from the correlation coefficient (r2) of the linear regression. The calibration curves were obtained by injecting five different concentrations of the GLY herbicide standards in a range of 5, 10, 15, 20 and 25 mg/ml (Santilio et al., 2019).
Limits of Detection and Limits of Quantification
The limits of detection (LOD) and limits of quantification (LOQ) of the method were measured by spiked serial dilution of working standards prepared for calibration curves and calculated by considering a value of 3 and 10 times of background noise, respectively. LOD was determined considering it as 3 times the signal-to-noise ratio, while LOQ was determined as 10 times the signal-to-noise ratio. This means that LOD and LOQ were determined as the lowest concentrations yielding a signal-to-noise (S/N) ratio of 3 and 10, respectively.
Chromatographic conditions
The chromatographic separation of the target analytes was performed based on previous methods (Bi et al., 2011, Bedassa et al., 2015; Martins-Júnior et al., 2009) with minor modifications. An isocratic elution with a binary mobile phase comprising 45% water (solvent A) and 55 acetonitrile (solvent B) was used throughout the analysis. Before the subsequent sample/extract injection, the HPLC column was washed by adjusting the mobile phase composition to 5% water (solvent A) and 95 acetonitrile (solvent B) for 15 min and then was conditioned with the mobile phase (55 acetonitrile and 45 water) for additional 20 minutes. Analysis was performed with the mobile phase flow rate of 0.3 mL min-1, column temperature set at 30o C, injection volume 10 µL and monitoring wavelength of 254 nm. Chromatograms of each of the samples and Data acquisition were affected by power stream Adept CECIL 4900.
Identification and Quantification
GLY pesticide residue was identified if the retention times matched those of the standards and the relative abundance was within 10 bandwidth of those of the standards. Identified GLY pesticide was quantified using the external standard method of comparing sample peak areas with those of the GLLY pesticide standards under the same conditions. Each sample was analyzed three times and the mean values were obtained. And the software attached to the data station was used to program individual GLY concentrations of individual maize grains samples based on calibration standards, injection volume, peak area, retention time and bandwidth
Recovery Studies
Recovery experiments was carried out based on methods proposed by (Fernandes et al., 2013; Liao et al., 2018) this is achieved by using blank samples which were selected for spiking. Pesticide standard solutions were prepared and used for spiking the blank samples. Each standard solution (1.0ml) was added to 10.0g of ground sample to give fortification levels of 2.5, 5.0, 10.0, 15.0 and 20.0 mg/g respectively. Each spiked sample was allowed to stand for six hours and then extracted, cleaned up and analyzed like the test samples as previously described above. The standard solutions were also run on HPLC under the same conditions as the spiked samples. Glyphosphate standards were calculated for both standard solutions and spiked samples. The percent recovery of GLY herbicide was then calculated as follows:

Health Risk Assessment
Health risk estimations were done based on the integration of herbicide analysis data, and exposure assumptions. The assumptions were made based on the United State Environmental Protection Agency’s guidelines (EPA, 1996). The Estimated Daily Intakes (EDI) of the herbicide residue and food consumption assumption were used to determine long-term health risks to consumers. The food consumption rate for cereal such as maize is quoted to be 0.1062 kg/person/day with an average body weight of 60 kg for an adult (MoFA, 2010). For each type of exposure, the EDI was obtained as stated in Equation 1 below (Darko and Akoto, 2008). The health risk indices were obtained by dividing the EDI by their corresponding values of ADI (Akomea-Frempong et al., 2017; FAO/WHO, 2019), assuming an average adult’s body weight of 60 kg. When the health risk index >1; the food involved is considered a risk to the consumers. When the health index is < 1>
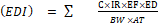
Where C is the concentration of the herbicide residue in maize grains in mg/kg, IR is the Ingestion rate or consumption rate for an adult (0.1062 kg), EF is Exposure frequency (365 days), ED is exposure duration which represents 55.12 years life expectancy rate, BW=Body weight of adult=60kg, AT= Average time of exposure × ED =365X55.12=28121.72. To understand the human health risk factor of contaminated maize, Joint Food and Agriculture Organization of the United Nations FAO/WHO Codex Alimentarius Commission has set the Acceptable daily intake (ADI) 0.1mg/kg in maize grains respectively (FAO/WHO, 2011). Health Risk Index was computed according to the following formula:

ADI= Acceptable Daily Intake for glyphosate= 0.1mg/kg
The estimation of non-carcinogenic health hazards from the consumption of maize grains was determined by equation 2 above as provided by the United States Environmental Protection Agency (USEPA), 1989, EPA, 2007, Akande et al., 2020).
The percentage recoveries of the GLY pesticide standard were found to be acceptable at 90.01-101% which indicates that the reproducibility of the method was satisfactory. The limits of detection pesticides standard were 0.011mgkg-1 and limits of quantification from 0.022 mgkg-1. Calibration curves have been produced for quantification. The calibration curve of the studied analysts shows satisfactory linearity over the selected concentration range with a regression correlation coefficient (r2) of 0.987332 for glyphosate.
The results obtained from each sample’s chromatogram as generated by the ADEPT software attached to the data station revealed that 25 out of the 26 samples i.e. 96.15% were contaminated with glyphosate residue at various levels of concentrations except G’WM samples. This represents 96.2% occurrence of GLY residue in all the samples collected. It was also observed that four samples i.e. 15.38% of analyzed samples were contaminated with GLY residue above. The MRL set by CODEX and European Union (EU) (Table 2). The mean GLY residual concentration was 3.474 mg/kg and with a range of 0 - 24.3mg/kg. GWM and LYM have the highest and lowest GLY concentration of 24.3 and 1.0 mg/kg respectively as shown in Table 2. Four samples i.e. 15.38% of the maize grains violated the CODEX Maximum Residual limit.
Glyphosate residue Concentration (mg/kg) in maize grain samples from Abuja, Nigeria
Table 2: Glyphosate residue Concentration (mg/kg) in maize grain samples from Abuja, Nigeria Market
| S/N | Sample ID | Glyphosate residue Concentration (mg/kg) in maize samples | S/N | Sample ID | Glyphosate residue Concentration (mg/kg) in maize samples |
| 1 | AYM | 1.147 ±0.012 | 14 | LWM | 2.700 ± 0.011 |
| 2 | AWM | 3.510 ± 0.021 | 15 | KYM | 4.280 ± 0.031 |
| 3 | KWYM | 3.989 ± 0.023 | 16 | KWM | 3.980 ± 0.002 |
| 4 | KWWM | 3.820 ± 0.013 | 17 | FMYM | 2.340 ±0.016 |
| 5 | SYM | 1.250 ±0.011 | 18 | FMWM | 1.700 ± 0.010 |
| 6 | SWM | 1.100 ± 0.021 | 19 | UWM | 1.234 ±0.032 |
| 7 | GWM | 24.30 ± 0.002 | 20 | UYM | 2.231 ± 0.045 |
| 8 | GYM | 8.520 ±0.012 | 21 | GWM | BDL |
| 9 | THSW | 4.740 ±0.020 | 22 | GYM | 8.520 ±0.011 |
| 10 | THYM | 2.300 ± 0.032 | 23 | NWM | 5.480 ± 0.000 |
| 11 | BWM | 2.000 ± 0.032 | 24 | NYM | 3.200 ± 0.0021 |
| 12 | BYM | 1.420 ±0.032 | 25 | WYM | 3.420 ± 0.040 |
| 13 | LYM | 1.000 ±0.022 | 26 | WWM | 2.200 ± 0.020 |
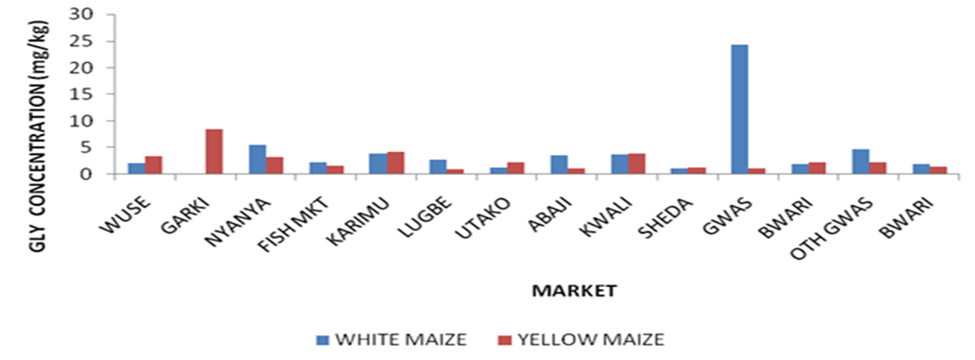
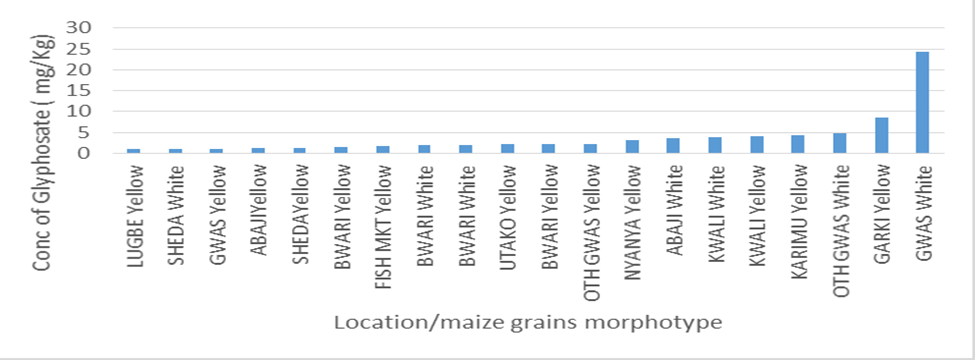
A comparative study between the level of GLY residue in the samples collected from Municipal and satellite town markets from Figure 1 revealed that the level that GLY residue is highest in GWM sample collected from Gwagwalada market followed by G’YM sample collected from Garki market. The level of contamination of glyphosate in the market located in the municipal and satellite towns was also compared graphically as seen in Figure 1 and it was revealed that the white maize morphotype collected from Gwagwalada has the highest concentration followed by yellow maize collected from Garki while samples from Sheda has the lowest concentration.
The level of contamination of glyphosate in the market located in the municipal and satellite towns was also compared graphically as seen in Figure 1 and it was revealed that the white maize (GWM) morphotype collected from Gwagwalada has the highest concentration followed by yellow maize collected from Garki (G’YM) while samples from Sheda market has the lowest concentration. Figure 2 revealed contamination of GLY according to their morphotype in ascending order. The graph revealed that GWM has the highest GLY contamination followed by G’YM while LYM has the lowest GLY contamination followed by SWM. The graphical illustrations revealed different contamination patterns between samples collected from markets located at municipal council and satellites town’s markets.
The health risk assessment of the sampled maize grains is shown in Table 3. The average daily intake (ADI) i.e. 0.1 mg/kg is the amount of GLY active ingredient that can be consumed daily over a lifetime without harm expressed in mg/kg body weight of the consumer. It was indicated that the EDI of glyphosate ranges from 0 to 2.308 x10⁻² mgkg-1
Table 3. Health Risk Assessment of maize grain sold in Abuja, Nigeria
| Sample ID | Estimated Dietary Intake (EDI) mg/kg | Hazard Risk Index (HRI) | Health Risk Status | Sample ID | Estimated Dietary Intake (EDI) mg/kg | Hazard Risk Index (HRI) | Health Risk Status |
| AYM | 1.089 ×10⁻³ | 2.17×10⁻² | None | LWM | 2.57×10⁻³ | 5.130×10⁻² | ‘’ |
| AWM | 3.335×10⁻⁴ | 6.669×10⁻³ | ‘’ | KYM | 4.07×10⁻³ | 8.132×10⁻² | None |
| KWYM | 3.789×10⁻³ | 7.579×10⁻² | ‘’ | KWM | 3.78×10⁻³ | 7.562×10⁻² | ‘’ |
| KWWM | 3.629×10⁻³ | 7.258×10⁻² | ‘’ | FMYM | 2.22×10⁻⁴ | 4.446×10⁻³ | ‘’ |
| SYM | 1.187 ×10⁻³ | 2.375×10⁻² | ‘’ | FMWM | 1.615×10⁻³ | 3.230×10⁻² | ‘’ |
| SWM | 1.045×10⁻³ | 2.09×10⁻² | ‘’ | UWM | 1.17×10⁻³ | 2.3446×10⁻² | ‘’ |
| GWM | 2.308 ×10⁻² | 4.617×10⁻¹ | ‘’ | UYM | 2.11×10⁻³ | 4.2389×10⁻² | ‘’ |
| GYM | 8.09×10⁻³ | 1.619×101 | ‘’ | GWM | BDL | BDL | ‘’ |
| THSW | 4.503×10⁻³ | 9.00×1024 | ‘’ | GYM | 8.094×10⁻³ | 1.6188×10⁻¹ | ‘’ |
| THYM | 2.185×10⁻³ | 4.37×10⁻² | ‘’ | NWM | 5.20×10⁻³ | 1.0412×10⁻¹ | ‘’ |
| BWM | 1.90×10⁻³ | 3.800×10⁻² | ‘’ | NYM | 3.04×10⁻³ | 6.08×10⁻² | ‘’ |
| BYM | 1.349 ×10⁻³ | 2.698×10⁻² | ‘’ | WYM | 3.25×10⁻³ | 6.498×10⁻² | ‘’ |
| LYM | 9.50×10⁻⁴ | 1.900×1024 | ‘’ | WWM | 2.09×10⁻³ | 4.18×10⁻² | ‘’ |
From the studies on food grains by Maigari et al. (2022) and Peter et al. (2017), glyphosate was found in some food grains, and processed grains such as bread flour and maize meal (Granby et al. (2003) found 0.087 mg/kg in rye and 0.093 mg/kg wheat and 1.25 mg/kg in barley grain. Glyphosate residue was also reported to have caused the deaths of fish at a concentration of 0.004 ml/L in Kano, Nigeria (NAN, 2018). Vicini et al. (2021) reported Glyphosate contamination in soybeans samples at different concentrations (0.1, 1.6, and1.8 mg/kg), besides, the USDA Pesticide Data Program (USDA, 2020) also conducts pesticide testing of foods related to infants and they tested 300 soybean samples grown in Missouri from 2010 to 2011. Glyphosate was detected in 90% of the samples and the average amount of glyphosate was 1.94mg/kg, with a maximum of 18.53 mg/kg. Besides, Kolakowski et al. (2020) tested some non-staple grains foods in Canada, the study encompassed 631 samples and out samples analyzed, 156 contained measurable but compliant residues, and 35 were found to be non-compliant. Kuan et al. (2023) also found GLY residue in fresh maize and soya bean ranging from 0.04-0.29mg/kg and 0.04-0.09 mg/kg, respectively.
Herbicide residue in food is usually monitored with reference to Maximum Residue Limits (MRLs) and Average Daily Intakes (ADIs). Codex Alimentarius Commission and EU set 5 mg/kg as the Maximum Residual Limit (MRL) of glyphosate in maize in 2006 (FAO/WHO, 2019). The MRL is an index that represents the highest concentration (expressed in mg kg_1) of the herbicide residue that is legally permitted or accepted in food or animal feed after the use of pesticides (FAO, 2002).
Consumer exposure is of concern if the Estimated Dietary Exposure to a pesticide exceeds the ADI (Maigari et al., 2022). The ADI is the estimated amount of a chemical in food (mgkg_1 body weight/day) that can be ingested daily over a lifetime without appreciable health risk to the consumer (Darko and Akoto, 2008; FAO/CODEX, 2011b).
Based on the toxicological evaluation, the calculated EDIs for this study are all below the CODEX/FAO/WHO maximum permissible limit of 0.1 mg/kg for GLY. This indicated that the consumers in the study area have no health risks from consuming the maize samples (FAO/WHO, 2013; Fucic et al.,2021). The results of the Health Index (HI) also showed that the HI ˂ 1 and according to (Bwatanglang et al., 2019; EPA, 2019, Maggi et al., 2021), if the HI ˂ 1 signifies no associated risk; meaning the exposed population is not likely to pose any significant adverse health risk. The result agrees with those of Bai et al., (2016) on glyphosate on human health via food contamination (Oyeyiola et al., 2017) and (Fedrick et al., 2018) both on dietary exposures to GLY herbicide where they obtained HI ˂ 1. The concern, however, is that the HI values are very close to the maximum value for the hazard index of 1. The effect of the consumed food items with the glyphosate residues may be additive or synergistic. This means that even pesticides that were detected at safe levels may eventually pose health hazards to humans due to combined and accumulated effects in the body (Maigari et al., 2022).
This study revealed glyphosate residue contamination in major markets in four locations in the FCT, Abuja. i.e. 15.38% violated CODEX Maximum Residual limit. Out of twenty-four maize grains samples investigated for the presence of glyphosate pesticide residue, four samples (which also represent 17.86%) violated the minimum standard set by CODEX Alimentarius Commission guidelines. These findings have shown that some maize samples were highly contaminated with glyphosate. The research has provided important information on GLY herbicide residue contamination in maize. This indicated that most of the maize grains in the FCT Abuja markets are currently safe for human consumption and do not pose a health risk.
Farmers are advised to embrace Good Agricultural Practices (GAPs) at all stages of maize grains production and processing to guarantee a continuous supply of safe foods to the markets in the FCT Abuja. Assessment of food products for pesticides residue should be carried out periodically to ensure sufficient data for regulatory bodies and policy makers such as Federal Ministry of Agriculture, National Agency for Food and Drug Administration and Control (NAFDAC), Standard Organization of Nigeria (SON) and other regulatory bodies in Nigeria. Analysis of pesticide residues in food is a key tool for monitoring the levels of human exposure to pesticide residues.
Author contributions
A.A.F. proposed the research idea and the study design, collected the study samples, shared in laboratory performance of the work, interpreted the results, wrote the manuscript; D.M.S. collected the study samples, assisted in laboratory work design and work, and revised the manuscript; T.S.A. assisted in performing the laboratory work and revised the manuscript. All authors read and approved the final manuscript.
Conflicts of interest
None of the authors have conflicts.
Acknowledgments
The authors are grateful to Chemistry Advanced Research Centre, Sheda Science and Technology Complex, Abuja Nigeria for carrying out the High-Performance Liquid Chromatography (HPLC) analysis for this research work. This study did not receive any specific grant from funding agencies in the public, commercial, or non -for - profit sectors.